UN46
Least Developed Countries: A Comprehensive Economic Overview
Analysis of 46 nations facing the world's most severe structural impediments to sustainable development, representing 1.2 billion people and spanning four continents.
The United Nations currently designates 46 countries as Least Developed Countries (LDCs), representing the world's poorest and most economically vulnerable nations. These countries face severe structural challenges including low income, weak human assets, and high economic vulnerability. With a combined population exceeding 1.2 billion people, LDCs account for approximately 14% of the global population yet contribute less than 2% of global GDP. Average GDP per capita across LDCs remains below $1,300, compared to the global average of approximately $12,000.
Country Dossiers
In-depth economic and political analysis—data-driven intelligence on nations shaping the Global South

Oil dependence, FX pressure, and fiscal reform in a tightening external environment
Read Report


Landlocked, donor-dependent, and politically isolated—survival economics at the margins
Read Report
Fragmented sovereignty, resource plunder, and Wagner Group mercenaries in Africa's hollow state
Read Report
Oil dependence, FX pressure, and fiscal reform in a tightening external environment
Read Report


Landlocked, donor-dependent, and politically isolated—survival economics at the margins
Read Report
Fragmented sovereignty, resource plunder, and Wagner Group mercenaries in Africa's hollow state
Read ReportRegional Distribution and Economic Profiles
LDCs are concentrated primarily in Sub-Saharan Africa (33 countries), with additional representation in Asia (9 countries), Pacific (3 countries), and the Caribbean (1 country). This geographical distribution reflects persistent structural challenges in specific regions, shaped by historical factors, geographical constraints, and limited economic diversification.
Africa
| Country | Population | GDP per capita | Life Expectancy | Primary Export |
|---|---|---|---|---|
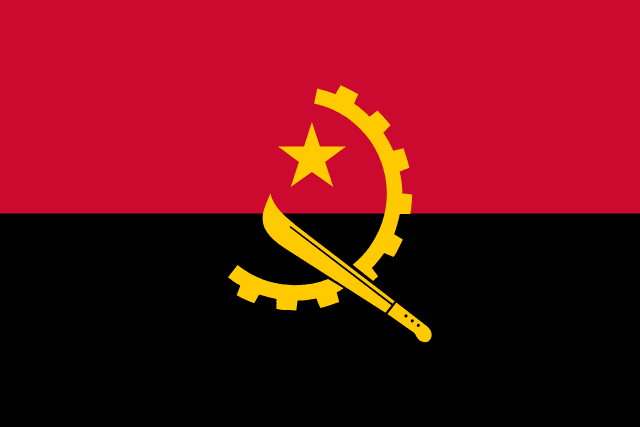
 Angola Angola |
36.7m | $2,042 | 61 years | Oil, diamonds |
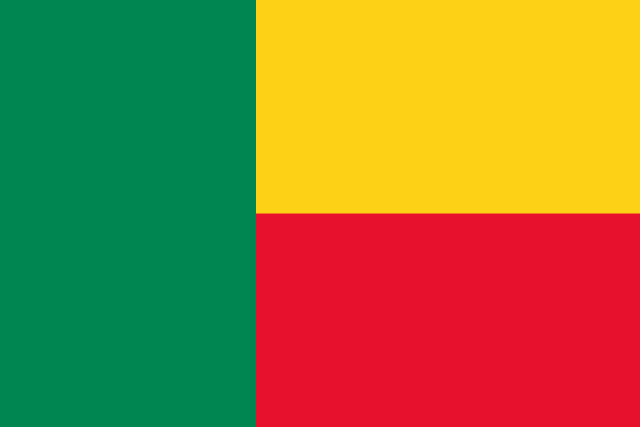
 Benin Benin |
13.7m | $1,367 | 62 years | Cotton |
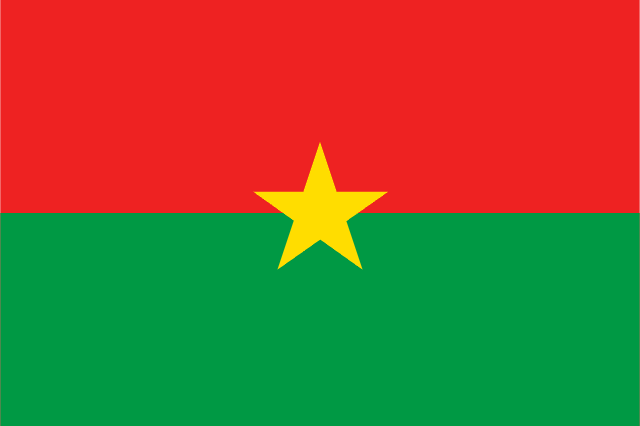
 Burkina Faso Burkina Faso |
23.3m | $876 | 62 years | Gold, cotton |
 Burundi Burundi |
13.2m | $237 | 62 years | Coffee, tea |
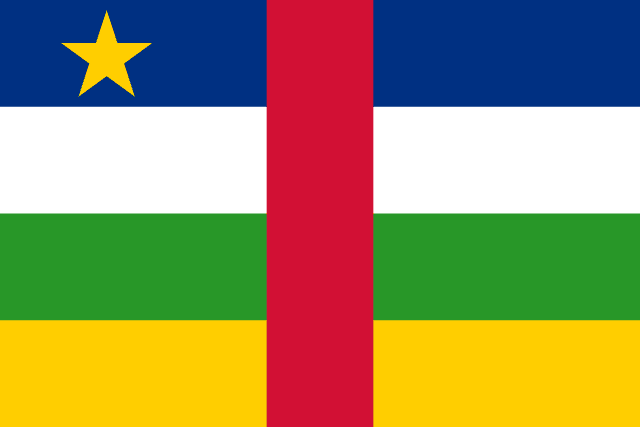
 Central African Rep. Central African Rep. |
5.6m | $511 | 53 years | Diamonds, timber |
 Chad Chad |
18.3m | $609 | 54 years | Oil |
 Comoros Comoros |
0.9m | $1,578 | 64 years | Vanilla, cloves |
 Dem. Rep. Congo Dem. Rep. Congo |
102.3m | $586 | 60 years | Cobalt, copper |
 Djibouti Djibouti |
1.1m | $3,414 | 67 years | Port services |
 Eritrea Eritrea |
3.7m | $625 | 66 years | Mining |
 Ethiopia Ethiopia |
126.5m | $1,020 | 66 years | Coffee |
 Gambia Gambia |
2.8m | $772 | 62 years | Groundnuts |
 Guinea Guinea |
14.2m | $1,215 | 61 years | Bauxite |
 Guinea-Bissau Guinea-Bissau |
2.2m | $852 | 58 years | Cashews |
 Lesotho Lesotho |
2.3m | $1,118 | 54 years | Textiles |
 Liberia Liberia |
5.4m | $677 | 64 years | Rubber, gold |
 Madagascar Madagascar |
30.3m | $515 | 67 years | Vanilla |
 Malawi Malawi |
20.4m | $643 | 64 years | Tobacco |
 Mali Mali |
23.3m | $876 | 59 years | Gold |
 Mauritania Mauritania |
4.9m | $1,673 | 64 years | Iron ore |
 Mozambique Mozambique |
33.9m | $507 | 60 years | Aluminum, coal |
 Niger Niger |
27.2m | $590 | 62 years | Uranium |
 Rwanda Rwanda |
14.1m | $966 | 69 years | Coffee, tea |
 São Tomé & Príncipe São Tomé & Príncipe |
0.2m | $2,290 | 70 years | Cocoa |
 Senegal Senegal |
18.0m | $1,607 | 68 years | Fish, groundnuts |
 Sierra Leone Sierra Leone |
8.8m | $527 | 60 years | Diamonds, iron ore |
 Somalia Somalia |
18.1m | $461 | 58 years | Livestock |
 South Sudan South Sudan |
11.9m | $237 | 58 years | Oil |
 Sudan Sudan |
48.1m | $752 | 65 years | Gold, livestock |
 Tanzania Tanzania |
67.4m | $1,192 | 66 years | Gold, tourism |
 Togo Togo |
9.0m | $1,046 | 61 years | Phosphates |
 Uganda Uganda |
48.6m | $1,046 | 63 years | Coffee |
 Zambia Zambia |
20.6m | $1,212 | 63 years | Copper |
Asia
| Country | Population | GDP per capita | Life Expectancy | Primary Export |
|---|---|---|---|---|
 Afghanistan Afghanistan |
42.2m | $368 | 64 years | Drugs, minerals |
 Bangladesh Bangladesh |
173.6m | $2,457 | 72 years | Garments |
 Bhutan Bhutan |
0.8m | $3,122 | 71 years | Hydropower |
 Cambodia Cambodia |
17.3m | $1,785 | 69 years | Garments |
 Laos Laos |
7.6m | $2,134 | 68 years | Copper, electricity |
 Myanmar Myanmar |
55.2m | $1,207 | 67 years | Natural gas |
 Nepal Nepal |
30.9m | $1,336 | 71 years | Textiles |
 Timor-Leste Timor-Leste |
1.4m | $1,381 | 69 years | Oil & gas |
 Yemen Yemen |
34.4m | $647 | 66 years | Oil |
Pacific
| Country | Population | GDP per capita | Life Expectancy | Primary Export |
|---|---|---|---|---|
 Kiribati Kiribati |
0.1m | $1,823 | 67 years | Fish |
 Solomon Islands Solomon Islands |
0.7m | $2,416 | 73 years | Timber, fish |
 Tuvalu Tuvalu |
0.01m | $4,867 | 67 years | Fish, .tv domain |
Caribbean
| Country | Population | GDP per capita | Life Expectancy | Primary Export |
|---|---|---|---|---|
 Haiti Haiti |
11.7m | $1,748 | 64 years | Textiles, mangoes |
Data compiled from national statistical offices, World Bank World Development Indicators, IMF World Economic Outlook (October 2024), UN DESA, African Development Bank, Asian Development Bank, Pacific Islands Forum Secretariat, and ECLAC. GDP per capita figures in current USD. Life expectancy represents latest available estimates. Population data from UN Population Division (2024 revision). Export classifications based on trade data from national customs authorities and UNCTAD. All figures verified against multiple sources where available.

