Stagflation Returns: Tariffs, Labour Shortages, and the US Price Shock
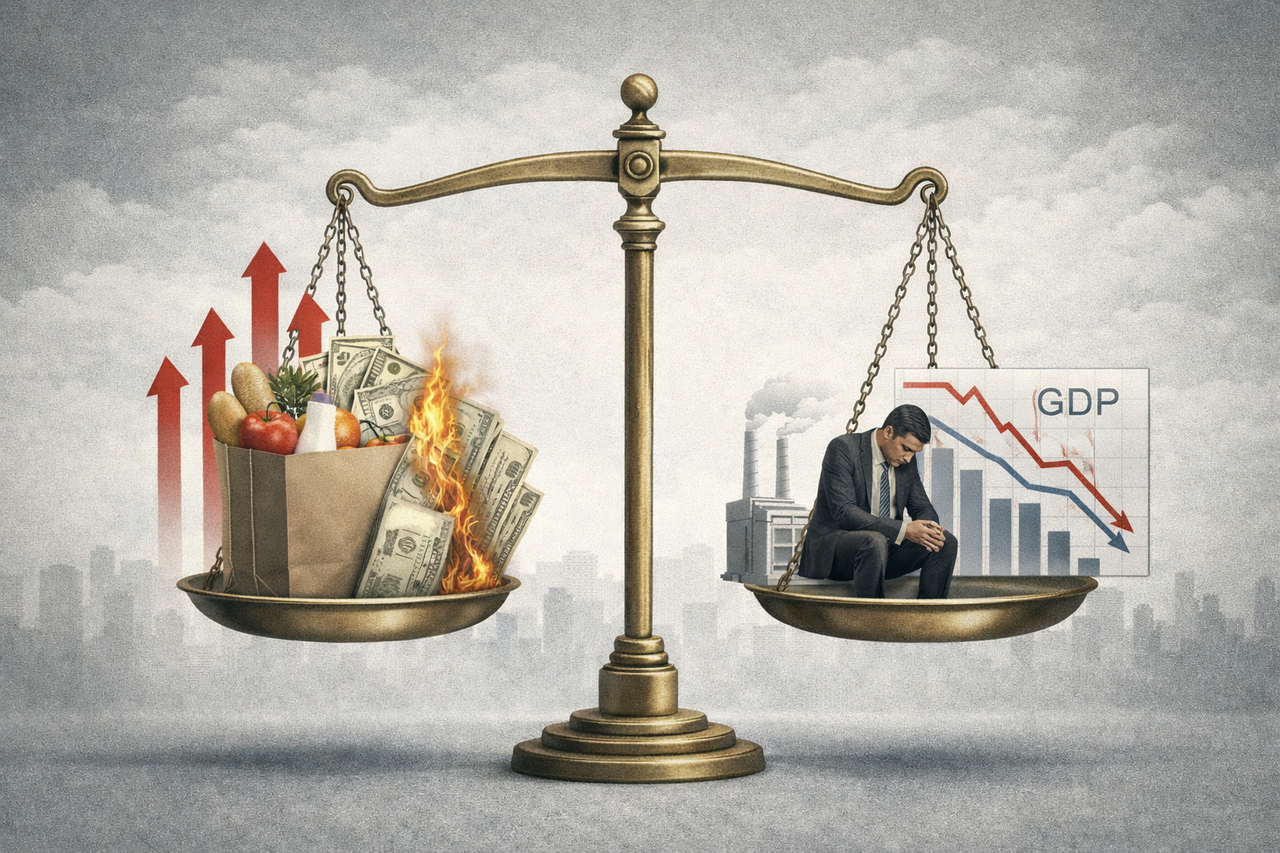
Stagflation is no longer a historical anomaly. It is re-emerging as a policy outcome. By mid-2026, the United States is experiencing slowing growth alongside persistent inflation. The causes are structural. Tariffs raise costs, labour restrictions suppress supply, demographic limits constrain flexibility, and a global monetary system no longer absorbs American inflation as it once did. What distinguishes this moment is not the presence of stagflation, but where its costs now fall. Domestically within the United States and unevenly across the global economy.
The Tariff Shock: Scale and Sequencing
From January to April 2025, the average applied US tariff rate rose from 2.5% to an estimated 27%, the highest level in over a century. After negotiations and rollbacks, the overall average effective tariff rate stood at 16.8% as of November 2025. This represents an order of magnitude increase from the sub-4% rates that prevailed for most of the last 50 years.
The sequencing reveals policy volatility. February 2025 saw 25% tariffs on Canada and Mexico plus 10% on China, citing fentanyl and immigration. April brought country-specific reciprocal tariffs of 10% to 41% on nearly all trading partners. By May, cargo ships carrying Chinese goods tariffed at 145% arrived with shipments cut in half. A 90-day truce with China was announced in May, then extended to November. Tariffs on USMCA-compliant goods were delayed, then suspended, then reimposed with exceptions.
Tariff Rates by Major Trading Partner (Post-Rollback, Nov 2025)
Escalated through retaliation spiral
USMCA-compliant goods reduced
Framework agreements reached
Trade deals negotiated
Reciprocal tariff framework
Universal minimum ("Liberation Day")
The Tax Foundation estimates Trump's proposed 20% universal tariff plus 60% on China would reduce long-run economic output by 1.3% before any foreign retaliation. The tariffs amount to an average tax increase of $1,200 per US household in 2025. JP Morgan calculates announced measures could boost Personal Consumption Expenditures prices by 1.0% to 1.5% in 2025, with inflationary effects concentrated in middle quarters.
Agriculture: The Retaliation Pattern
As trade frictions intensified, China reduced purchases of American farm products, redirecting demand toward Argentina and Brazil. Before the 2018-2019 trade war, China regularly imported 30 million to 36 million metric tons of US soybeans annually, more than one-third of all American soybean exports. By 2025, Beijing had signed long-term contracts with Brazil and Argentina. An October 2025 deal promised China would buy 25 million metric tons of US soybeans annually, but relief proved mostly symbolic.
| Metric | Pre-2018 | 2025 Status | Impact |
|---|---|---|---|
| China soybean imports from US | 30-36M metric tons | 25M metric tons (promised) | One-third of exports lost |
| Soybean prices | Baseline | 40-50% below 2018 | Record unsold volumes stored |
| Farm bankruptcies | Baseline 2024 | +55% (2025 Q1) | Up again first quarter |
| Government aid packages | $0 | $12B emergency relief | Aid replaces income not demand |
Farm bankruptcies rose 55% in 2024 according to the American Farm Bureau Federation. University of Arkansas extension economist Ryan Loy reported bankruptcies up again in first quarter 2025. Farmers describe increasingly dire circumstances stemming from trade wars, immigration crackdowns, inflation, and high interest rates. American Soybean Association president Caleb Ragland warned in September 2025 that farmers so far at the end of their rope, unable to meet financial obligations, might choose to take their own lives. CDC data shows farmers already face higher suicide rates than the general population.
This imbalance is instructive. Aid replaces income but not demand. Compensation masks loss without restoring competitiveness. The fiscal burden rises while structural damage remains.
Labour Restrictions and Cost-Push Inflation
Immigration enforcement reduces labour supply in agriculture, construction, logistics, food processing, and services. Sectors where margins are thin and prices are sensitive. The foreign-born labour force declined by approximately 1.2 million people from January to July 2025. The annual number of immigrants, legal and undocumented, fell from roughly 4 million at the 2023 peak to 300,000 to 350,000 by late 2025.
Construction is particularly exposed. About 34% of construction workers are immigrants versus 20% average across all sectors. In trades like drywall installers or plasterers, the share approaches 60%. Bank of America Institute reported average wage growth in construction approached 8% in July 2025, nearly double the national average.
A shortage of skilled labour already costs the US economy about $10.8 billion per year due to longer construction times and raises the price of new single-family homes by about $2,600 on average. Labour shortages lift housing and infrastructure costs, feeding directly into rents, municipal budgets, and public investment overruns.
The American Immigration Council estimates mass deportations would remove up to 1.5 million workers from construction, 225,000 from agriculture, one million from hospitality, 870,000 from manufacturing, and 461,000 from transportation. Apollo chief economist Torsten Sløk calculated that deporting 3,000 undocumented immigrants per day for a year would lower the labour force by 1 million people. Deportations are a stagflationary impulse to the economy, resulting in lower employment growth and higher wage inflation.
The Price Transmission Mechanism
Moody's chief economist Mark Zandi stated in August 2025 that if Trump continues deporting immigrants at the current rate, inflation will go from 2.5% to somewhere close to 4% by early 2026. Fresh and dry vegetable prices surged almost 40% in the latest Producer Price Index. While tariffs and weather factor in, Zandi identified immigration restrictions as a major culprit. You can see it in meat prices, agriculture, food processing, haircuts, dry cleaning. The fingerprints of the restrictive immigration policy are all over the CPI and PPI numbers.
Demographics and Labour Force Contraction
The labour constraint is demographic, not cyclical. The total US labour force has fallen for three consecutive months, declining by 402,000 people from January to July 2025, to about 170.3 million. Federal Reserve Chair Jerome Powell cited immigration policy as a factor behind the slowdown in labour supply in July 2025. Because of immigration policy really, the flow into our labour forces is just a great deal slower.
AEI research projects the net change in population of immigrants over age 16 in the range of -525,000 to +115,000 in 2025, down from 2.2 million in 2024. This shift reduces GDP growth in 2025 by 0.3 to 0.4 percentage points as potential employment growth is cut from 140,000 to 180,000 jobs monthly in 2024 to 10,000 to 40,000 jobs monthly in second half 2025.
Absorbing Inflation at the Core
The United States is relatively insulated from trade exposure, which now works against it. Inflation generated domestically is no longer easily exported. Peterson Institute research projects tariffs in place as of September 2025 would reduce US GDP, raise prices, and lower American wages compared to baseline. Employment declines most in durable goods manufacturing, mining, and agriculture. Sectors most exposed to decline in US exports caused by relative price shifts.
Inflation rises 1 percentage point higher than baseline for the year from September 2025. Although the inflation increase is temporary, the US price level remains higher thereafter than it would have been without tariffs.
Exporting Volatility to the Global South
Higher US rates tighten global financial conditions. Dollar volatility pressures emerging-market currencies. Borrowing costs rise. Import prices increase. Central banks in the Global South face a familiar dilemma. Defend currencies and suppress growth, or ease and risk imported inflation. The transmission runs through multiple channels simultaneously, creating compound stress that overwhelms policy buffers.
The Dollar Whipsaw: Strength, Collapse, Volatility
The dollar dynamics of 2025 reveal a paradox. The US Dollar Index fell 10.7% in the first half of 2025, marking its worst performance for this period in over 50 years. Yet emerging markets suffered throughout. The resolution lies in sequencing and volatility rather than direction alone.
Early 2025 saw dollar strength near historic highs, still buoyed by a 10-year bull market fueled by strong economic growth, deep capital markets, and higher interest rates than much of the developed world. Between 2022 and 2024, aggressive Federal Reserve tightening pushed the dollar higher against almost every major currency. Then the narrative unraveled. Tariff announcements and policy uncertainty forced investors to rethink growth, inflation, and public debt simultaneously. From January through June, the dollar fell roughly 11% against a basket of major currencies, formally ending a long era of dollar dominance.
Foreign investors hold over $30 trillion in US assets, much historically left unhedged, an implicit bet on continued dollar strength. As the currency weakened in early 2025, those same investors began adding currency hedges, effectively selling dollars into the market. The scale of this rebalancing amplified volatility. Non-US domiciled ETFs investing in US equities averaged net flows of $10.2 billion from January to July 2024 but only $5.7 billion over the same period in 2025. European investors allocated more to local assets, with European-focused ETFs receiving a record $42 billion in net flows year-to-date as of July.
For emerging markets, dollar strength and dollar weakness both inflict damage through different mechanisms. Strength raises debt service costs and triggers capital outflows. Weakness creates commodity price surges and import cost inflation. Volatility itself prevents planning and forces defensive positioning that constrains growth. The whipsaw matters more than the direction.
Turkey: High Rates, Persistent Inflation, Currency Erosion
Turkey demonstrates the bind. The Central Bank of Turkey maintains elevated real interest rates even after recent cuts, making the lira a compelling risk-adjusted carry trade asset for foreign investors seeking yield. Yet domestic inflation persists. The contradiction between attracting foreign capital through high rates and supporting domestic growth through lower rates creates policy paralysis. Currency volatility punishes both savers and borrowers. Import costs fluctuate wildly. Investment decisions get deferred indefinitely.
Nigeria: Naira Collapse and Foreign Exchange Scarcity
Nigeria faces acute foreign exchange scarcity despite being an oil exporter. The naira has gained some traction recently, supported by narrowing current account deficits and rising foreign exchange reserves according to some analysts. But the structural vulnerability remains. Oil revenue volatility, dependence on imported refined petroleum products despite crude exports, and mounting external debt create a triple constraint. When the dollar strengthens, naira depreciation accelerates. Import costs surge. Inflation feeds through to food prices immediately in an economy where households spend large portions of income on basics. When the dollar weakens, commodity price increases in dollar terms still translate to naira inflation through the import channel.
Argentina: Peso Collapse Despite Reform
Argentina illustrates how even aggressive reform cannot overcome external dollar dynamics. President Javier Milei implemented radical economic restructuring. The US Treasury approved a $20 billion currency swap deal with Argentina in October 2025, supporting Milei politically while Argentina remains a direct agricultural competitor to US farmers. Yet the peso continues collapsing. Dollarization sentiment persists. Capital flight has not reversed despite policy credibility gains. The problem is structural. Decades of monetary instability created a preference for dollar holdings that policy alone cannot overcome quickly. Every dollar appreciation episode triggers fresh capital flight regardless of current policy stance.
Pakistan: IMF Program Strain and Import Compression
Pakistan operates under IMF program constraints while managing dollar-denominated debt and import dependency. Fitch downgraded Pakistan's sovereign rating in 2022 after widespread flooding reduced foreign exchange reserves and worsened external liquidity. The IMF program requires fiscal consolidation and monetary tightening precisely when economic conditions call for support. Import compression becomes the adjustment mechanism. Businesses cannot access dollars for essential inputs. Manufacturing slows. Growth contracts. The political sustainability of IMF conditions erodes even as economic necessity demands compliance.
The Vicious Cycle: Currency, Capital, Debt
For countries with large current account and fiscal deficits coupled with low foreign exchange reserves, dollar dynamics trigger a vicious cycle. Currency devaluation increases the local currency cost of dollar-denominated debt service. Higher debt service constrains fiscal space. Constrained fiscal space limits investment in productivity or adaptation. Lower productivity growth weakens currency fundamentals. Weaker fundamentals invite speculative pressure. Capital outflows accelerate. Foreign exchange reserves deplete. Central banks face impossible choices between defending currencies through rate hikes that crush growth, or allowing depreciation that raises inflation and debt burdens.
The strong dollar exacerbates this dynamic, increasing external debt servicing costs and raising the specter of sovereign debt crisis particularly in Sub-Saharan Africa and Latin America. Even dollar weakness provides limited relief. If the weaker dollar triggers market volatility or reversals in capital flows, the benefit proves short-lived. Because most global commodities including oil, wheat, and metals are priced in dollars, weaker dollars usually lead to higher commodity prices. Gold surged above $4,350 per ounce in October 2025, an all-time high, as investors sought hedges against currency depreciation and monetary uncertainty.
Broader Economic Impact
JP Morgan Global Research projects global real GDP growth at 1.4% in fourth quarter 2025, down from 2.1% at start of year. Brazil faces 50% tariffs effective August 2025, significantly exceeding the 10% Liberation Day rate. If this tariff scenario becomes long-lasting with effective tariff around 40%, Brazil's GDP could potentially be reduced by 0.6% to 1.0%, though impact could be mitigated by diversifying exports to other countries.
The elevated debt burden in many emerging economies, a legacy of pandemic-era borrowing, compounds the problem. High and divergent interest rates pressure growth as advanced economy central banks maintain restrictive policy while emerging market central banks grapple with persistent inflation, often compelling them to hike rates themselves despite domestic weakness. Historical parallels to the Asian Financial Crisis of 1997-1998 and the Latin American Debt Crisis of the 1980s appear, both characterized by sudden capital flight and struggles with foreign currency debt. Many emerging markets today possess greater international reserves and more flexible policy frameworks, indicating learned resilience. But vulnerabilities persist for those with fragile external positions.
Banking, Credit, and Financial Transmission
US banks are resilient but cautious. Credit creation slows precisely when businesses need working capital to navigate tariff cost increases and labour shortages. Construction firms cannot access credit to pre-finance projects despite rising demand. Farmers denied operating loans face harvest financing gaps. Small businesses reliant on inventory financing see credit lines reduced or withdrawn.
The caution reflects rational risk management. Banks price higher default risk from stagflationary conditions into lending standards. Loan committees view tariff uncertainty and immigration enforcement as operational risks that reduce borrower creditworthiness. Regional banks, particularly those serving agricultural communities or construction-heavy markets, tighten most aggressively. The result is procyclical credit contraction that amplifies the growth slowdown.
Capital flows compound the dynamic. As foreign investors add currency hedges on their $30 trillion in US asset holdings, they effectively sell dollars into the market. This selling pressure creates feedback loops. Dollar weakness makes US assets less attractive on a currency-adjusted basis. Reduced foreign demand for US assets means less capital inflow. Less capital inflow means upward pressure on borrowing costs even as the Federal Reserve holds policy steady. Mortgage rates remain elevated despite no further Fed tightening. Corporate bond spreads widen. Municipal borrowing costs increase.
For emerging markets, the capital flow reversal proves severe. In emerging market economies, the effects of strong dollar periods spread via trade and financial channels. Real trade volumes decline sharply, with imports dropping twice as much as exports. Emerging markets suffer disproportionately across key metrics including worsening credit availability, diminished capital inflows, tighter monetary policy, and bigger stock market declines.
Energy, Commodities, and the Inflation Amplifier
Energy policy reveals further contradictions. Indirect reliance on Russian oil flows and renewed engagement with Venezuela act as inflation controls rather than ideological reversals. The weak dollar mechanism compounds commodity price pressures. Because most global commodities including oil, wheat, copper, and metals are priced in dollars, weaker dollars usually lead to higher commodity prices regardless of supply-demand fundamentals.
Gold surged above $4,350 per ounce in October 2025, an all-time high, as global investors viewed precious metals and real assets as hedges against currency depreciation and monetary uncertainty. Oil price movements feed through immediately. Wheat price increases raise food import costs across the Global South. Copper and industrial metals pressure manufacturing input costs globally.
For Global South food importers, the compound effect proves devastating. Dollar weakness raises commodity prices in dollar terms. Local currency weakness against the dollar raises import costs in local currency terms. The multiplication creates food price spikes that overwhelm household budgets. Countries that import 60% or more of food consumption face immediate political pressure. Subsidy costs surge. Fiscal balances deteriorate. The cycle reinforces itself.
US Inflation Sources (2025 Composite)
Wage growth in immigrant-heavy sectors
Import cost increases to consumers
Energy, food, metals (dollar-denominated)
Construction labour + material costs
Monetary, expectations, services
Japan and the Ally Subsidy
Allies absorb strain to stabilise the system. Japan, the largest foreign holder of US Treasuries, bears currency and inflation costs to maintain dollar stability. The US-Japan framework agreement reached in 2025 set tariffs on Japanese goods including automobiles at 15%, significantly below the 25% figure previously floated. This could lift Japanese corporate earnings by 3 percentage points or GDP by 0.3 percentage points on a year-over-year basis according to JP Morgan estimates.
But the currency cost remains substantial. Japanese investors holding dollar-denominated US Treasuries face yen appreciation when the dollar weakens, creating mark-to-market losses. Bank of Japan intervention to prevent excessive yen strength depletes foreign exchange reserves and creates domestic monetary accommodation that feeds inflation. The political sustainability of this arrangement depends on US security commitments and regional stability guarantees that justify the economic subsidy.
Meanwhile, some Arab energy exporters settle portions of trade in yuan or alternative arrangements, not to reject the dollar but to assert optionality. Stablecoin adoption grows in emerging markets for savings, cross-border payments, remittances, and corporate cash management. Stablecoin issuers cumulatively became the 19th largest holder of US debt at $120 billion by 2025, more than Germany's holdings. The growth occurred as stablecoins were increasingly adopted by non-crypto users in emerging market countries seeking dollar exposure without direct dollar holdings.
Federal Reserve: Politics, Independence, and the Policy Bind
The Federal Reserve faces the classic stagflation dilemma compounded by political pressure. Raise rates to combat inflation and deepen the growth slowdown, or hold steady and allow inflation to persist. Either path imposes costs. The July 16, 2025 incident reveals the stakes. Comments about Fed Chair Powell's potential dismissal led to a 1.2% drop in the dollar within one hour, though it has since rebounded. Lingering concerns about Fed independence continue to exert downward pressure on the dollar and upward pressure on long-term interest rates as markets price political risk premium.
Powell cited immigration policy as a factor behind the slowdown in labour supply in July 2025. Because of immigration policy really, the flow into our labour forces is just a great deal slower. This acknowledgment places the Fed in difficult territory. The growth slowdown stems partly from policy choices outside monetary control. The inflation acceleration stems partly from those same policies. The Fed's tools cannot address labour supply or tariff costs directly. Monetary policy operates through aggregate demand. But the problem is aggregate supply.
Market expectations diverge from Fed guidance. Traders price rate cuts based on growth slowdown concerns. The Fed resists signaling cuts based on inflation persistence. The gap between market pricing and Fed communication creates volatility. Foreign exchange markets, equity markets, and bond markets all respond to this uncertainty with risk-off positioning. Capital flows become erratic. Financing conditions tighten even without explicit Fed action.
The Stagflation Window
Stagflation is episodic but damaging. It narrows policy space, erodes trust, and complicates planning. The United States enters this window through aligned policy constraints on labour, trade, and capital. For the Global South, the lesson is stark. Discipline matters, but it does not confer immunity in a dollar-centred system.
The fundamental mechanics are clear. Tariffs act as consumption taxes with delayed benefits and immediate costs. Immigration enforcement removes labour supply in precisely those sectors where cheap labour has long acted as an unspoken anti-inflation tool. Demographic constraints mean this labour cannot be easily replaced. The adjustment window is inflationary by design.
As growth slows, earnings compress. Investment hesitates. Prices remain sticky. Monetary policy becomes blunt precisely when precision is needed. The Federal Reserve faces the classic stagflation dilemma. Raise rates to combat inflation and deepen the growth slowdown, or hold steady and allow inflation to persist. Either path imposes costs.
What makes this moment particularly challenging is its policy-driven character. The 1970s stagflation emerged from oil shocks and monetary accommodation. This iteration stems from deliberate tariff escalation and immigration restriction. Policy created the dynamic. Policy volatility sustains it.
Stagflation returns not as a relic of the past, but as a reminder that when politics rewires the economy, prices respond first and retreat last.
Historical Parallel: The 1970s Comparison
The current moment invites comparison to 1970s stagflation. Both periods feature simultaneous inflation and growth stagnation. But the mechanisms differ substantially, with important implications for policy response and duration.
| Dimension | 1970s Stagflation | 2025 Stagflation |
|---|---|---|
| Primary Trigger | Oil shocks (1973, 1979) - external supply disruption | Tariffs + immigration restriction - deliberate policy choices |
| Inflation Source | Energy prices feeding through to all sectors | Labour scarcity + tariff pass-through + commodity prices |
| Policy Response | Volcker shock therapy (20% interest rates, 1980-1982) | Fed caution under political pressure, independence threatened |
| Labour Market | Union power, wage-price spiral, COLA adjustments | Immigration restriction, demographic constraint, sector-specific shortages |
| Global Impact | Latin America debt crisis (1980s), developing country defaults | EM currency pressure, vicious cycle of devaluation and capital flight |
| Duration | Decade-long (1973-1982), required severe recession to break | Window opened 2025, duration depends on policy reversal or persistence |
| Peak Inflation | 14.8% (March 1980) | Projected 4% (early 2026 if deportations continue - Zandi estimate) |
| Political Context | Nixon price controls failed, Carter energy crisis, Reagan reversal | Trump tariff volatility, immigration enforcement, Fed independence questions |
The 1970s required a decade and severe recession to resolve. Volcker's Federal Reserve raised rates to 20%, triggering unemployment above 10%. The pain proved necessary to break inflation expectations and wage-price spirals. The current episode may require less extreme measures because inflation sources differ. Labour scarcity can be addressed through visa policy changes. Tariffs can be rolled back. But political willingness to reverse course remains uncertain. If policy persists, the stagflationary dynamic could extend beyond 2026.
Three Scenarios for 2026
The trajectory from here depends on policy choices rather than economic fundamentals alone. Three scenarios frame the possibilities, each with distinct implications for the United States and the Global South.
Scenario 1: Policy Reversal and Gradual Easing
Probability: 30%
Tariff rollbacks accelerate through bilateral deals. The framework agreements reached with Japan, South Korea, Vietnam, Philippines, and Indonesia in mid-2025 expand to cover larger trade volumes. China-US tensions ease with extension of the 90-day truce. Effective tariff rates decline from 16.8% toward 10% baseline over 12-18 months. H-1B visa programs expand with fee reductions from the $100,000 peak. Sector-specific visa programs for agriculture and hospitality receive legislative approval, partially restoring labour supply.
Under this scenario, inflation gradually declines from current levels toward 2.5% by end-2026. Growth stabilizes around 2%. The Fed gains room to cut rates modestly, perhaps 50-75 basis points total. Dollar volatility declines. Emerging market currencies stabilize. Capital flows to Global South resume gradually. The stagflation window closes without requiring recession.
Key risks: Political commitment to reversal remains uncertain. Farm sector and manufacturing constituencies press for tariff maintenance. Immigration hardliners resist visa expansion. Partial reversal proves insufficient to restore full labour supply or trade flows.
Scenario 2: Policy Persistence and 4% Inflation
Probability: 50%
Tariffs remain substantially in place through 2026 with modest bilateral adjustments. Immigration enforcement continues at roughly 750 deportations per day average. H-1B fees stay elevated. Agricultural and hospitality worker programs stall in legislative process. Labour force growth remains constrained at 10,000 to 40,000 monthly additions compared to 140,000 to 180,000 previously.
Moody's chief economist Mark Zandi's forecast materializes. Inflation rises from current 2.5% to approach 4% by early 2026. The Federal Reserve holds rates steady or cuts modestly (25 basis points maximum) given inflation persistence. Growth slows to 1.5% or below. Unemployment rises slightly but remains contained because labour force itself shrinks. The output gap widens. Productivity growth disappoints. Real wage growth turns negative for median workers even as nominal wages rise.
For the Global South, this scenario extends current pressures. Dollar volatility persists. Commodity prices remain elevated. Emerging market central banks maintain restrictive policy to defend currencies. Growth across developing economies averages 1-2 percentage points below potential. Debt distress cases increase, particularly in Sub-Saharan Africa and highly-indebted Latin American economies. IMF program requests rise. Capital flows to emerging markets remain suppressed.
Key characteristics: Stagflation becomes persistent rather than episodic. Policy space narrows domestically and globally. Political pressure on the Fed intensifies. Market volatility increases. Planning horizons shorten for businesses and households. Social cohesion erodes as lived experience diverges from aggregate indicators.
Scenario 3: Escalation to Recession Plus Inflation
Probability: 20%
Mass deportations reach 1 million per year as legislated funding of $150 billion for immigration enforcement gets deployed fully. ICE agent hiring accelerates. Detention capacity expands. Workplace raids intensify across agriculture, construction, food processing, and services. The foreign-born labour force contracts by 2-3 million over 12 months. Sectors reliant on immigrant labour face acute shortages. Construction activity declines sharply. Agricultural output drops. Food processing plants idle capacity. Services sector employment falls.
Simultaneously, trade war escalates. The 90-day China truce expires without extension. Tariffs on Chinese goods return to 145% range. China retaliates equivalently. Trade between the world's two largest economies approaches effective embargo. Supply chains fracture. Businesses exhaust inventory buffers. Shortages emerge in consumer goods, industrial inputs, and critical components. Inflation accelerates above 4% toward 5-6% range despite growth contraction.
GDP growth turns negative. Unemployment rises above 5% as sectors shed workers faster than service sector can absorb them. The combination of rising unemployment and rising inflation creates classic stagflation crisis. The Federal Reserve faces impossible choices. Rate cuts to support growth risk validating inflation expectations. Rate holds or increases to combat inflation deepen recession. Political pressure for emergency measures intensifies. Dollar volatility spikes. Safe haven flows create paradoxical dollar strength amid crisis.
For the Global South, this scenario triggers acute distress. Capital flight from emerging markets accelerates. Currency crises spread beyond individual countries to regional contagion. Debt defaults cluster, overwhelming IMF and World Bank capacity. Trade finance dries up. Import compression forces sharp consumption declines. Food insecurity rises. Political instability follows economic collapse. The parallels to 1980s Latin America debt crisis or 1997-98 Asian financial crisis become explicit.
Policy responses required: Emergency measures including potential capital controls in emerging markets. Coordinated central bank interventions. IMF/World Bank emergency facilities expansion. Potential G20 coordination on trade de-escalation. Domestic US policy would require choosing between inflation and employment, likely accepting recession to break inflation spiral.
Implications and Conclusion
The return of stagflation marks a profound shift. For four decades since Volcker broke the 1970s cycle, advanced economies assumed the problem had been solved. Central banks could manage inflation through interest rates. Globalization and immigration would keep labour costs contained. Trade would remain substantially open. These assumptions no longer hold.
What makes 2025 different is the policy-driven character. Governments chose tariffs. Governments chose immigration restriction. These were not external shocks beyond control but deliberate decisions. The implications matter for resolution. External shocks eventually dissipate or get adapted to. Policy choices can be reversed or persist indefinitely depending on political will.
For the Global South, the lesson remains stark. Prudent fiscal management, strong institutions, and careful debt management reduce vulnerability but do not confer immunity. When the core economy generates stagflationary pressure through policy choices, peripheral economies absorb the shock regardless of domestic discipline. The dollar-denominated global financial system transmits American policy volatility with amplification.
The window is open. How long it remains open depends on choices not yet made. But while open, the costs accumulate. Investment gets deferred. Planning horizons shorten. Trust erodes. The gap between official data and lived experience widens. And in that gap, political economy shifts in ways that outlast the immediate economic distress.
Stagflation is episodic but damaging. It narrows policy space, erodes trust, and complicates planning. The United States enters this window through aligned policy constraints on labour, trade, and capital. For the Global South, discipline matters, but it does not confer immunity in a dollar-centred system. When politics rewires the economy, prices respond first and retreat last. The costs fall unevenly, the adjustments prove slow, and the ultimate duration remains uncertain.