The £3 Trillion Question: Britain's Debt, the Interest Trap, and the Path Nobody Wants to Take
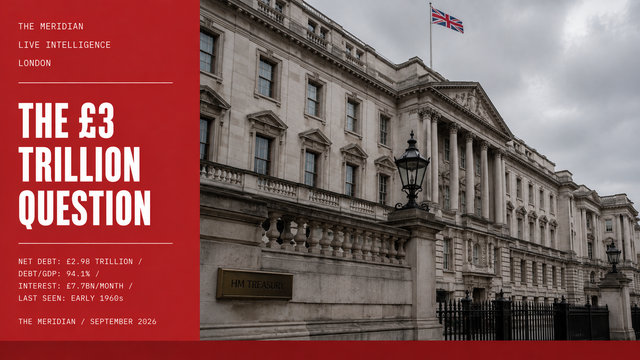
For a nation that prides itself on fiscal prudence, the numbers flashing on the Treasury's dashboard make for grim reading. Britain's public sector net debt stood at £2.98 trillion at the end of July 2026, equivalent to 94.1 per cent of GDP, a level of proportional indebtedness last witnessed in the early 1960s as the country was still shaking off the financial hangover of the Second World War. Yet for the discerning observer of British macroeconomics, the headline figure obscures a more nuanced reality: how the debt was accumulated, who holds it, what it costs to service, and what it would actually take to reduce it.
It is tempting to view a near-£3 trillion debt pile as evidence of a runaway state. However, the trajectory tells a slightly less alarming story. The debt-to-GDP ratio of 94.1 per cent actually represents a modest improvement, falling by 0.8 percentage points compared to the same month a year earlier. Government borrowing in the financial year to July 2026 amounted to £56.7 billion, some 1.8 per cent of GDP, which is 0.3 percentage points lower than the previous year and £6.0 billion lower than the equivalent period in 2025. Notably, this marks the 12th lowest April-to-July borrowing period since comparable monthly records began in 1993. The state is still bleeding cash, but the tourniquet is beginning to hold. The current budget, the borrowing used to fund the day-to-day operations of the public sector, even ran a surplus of £3.1 billion in July 2026. Self-assessment tax receipts in July reached £17.1 billion, the highest for any July on record, according to the Office for National Statistics. These are not the numbers of a government entirely out of fiscal control. They are, however, the numbers of a government that has not yet found the growth to make the problem structurally manageable.
The real bind for the Chancellor does not stem entirely from the absolute size of the debt, but from the cost of servicing it. Central government interest payable hit £7.7 billion in the month of July 2026 alone, a 9.6 per cent increase from the same period in 2025. Across the full 2025/26 financial year, the government spent over £100 billion on debt interest, more than the entire annual budget for education. When debt servicing consumes such a vast proportion of the Exchequer's receipts, it crowds out the public investments in infrastructure, health, and education that are desperately needed to spur productivity.
This creates a structural trap. Britain requires sustained economic growth to organically dilute its debt burden, just as it did during the post-war boom of the 1950s and 1960s. Yet the high cost of servicing the current debt pile restricts the fiscal headroom required to stimulate that exact growth. To escape this macroeconomic bind, the government cannot merely rely on fiscal drag to boost its coffers, nor can it continuously raise the tax burden without stifling private enterprise. The path forward demands an unwavering focus on the supply side of the economy: reforming planning laws to build infrastructure, encouraging capital investment, and boosting workforce participation. Until the denominator of the British economy, GDP, begins to outpace the numerator, the debt, with genuine conviction, Westminster will remain a hostage to its own balance sheet.
The UK's national debt is the accumulation of decades of government borrowing, where the state has spent more than it has collected in taxes and revenues. While the £2.98 trillion figure is staggering, it was not accumulated overnight. It is the result of massive economic shocks, demographic shifts, and the compounding arithmetic of interest rates. Four drivers explain the trajectory.
The legacy of acute economic shocks. The most significant leaps in the national debt over the last century have not been caused by day-to-day overspending, but by the government stepping in as the insurer of last resort during acute crises. Prior to 2008, UK debt was relatively stable at around 35 per cent of GDP. The collapse of the banking sector forced the government to borrow hundreds of billions to bail out major institutions, while simultaneously dealing with a collapse in tax revenues and a surge in welfare payments during the ensuing recession. By 2012, debt had more than doubled to over 80 per cent of GDP. The COVID-19 pandemic necessitated unprecedented peacetime state intervention: hundreds of billions to fund the furlough scheme, business support grants, and the scaling-up of NHS and testing infrastructure, causing the debt-to-GDP ratio to spike again. Then, following Russia's invasion of Ukraine, global energy prices surged. To prevent millions of households and businesses from defaulting on utility bills, the UK government subsidised energy costs, adding tens of billions to the national borrowing total. Three crises in fourteen years. Each one rational in isolation. Collectively, they doubled the debt-to-GDP ratio.
A stagnant denominator. Debt is most accurately measured as a percentage of the overall economy. Following the Second World War, UK debt exceeded 200 per cent of GDP, but was reduced over subsequent decades not through aggressive austerity, but through robust, prolonged economic growth. Since the 2008 financial crisis, UK productivity and economic growth have largely stagnated. When the economy, the denominator, does not grow faster than the interest accumulating on the debt, the burden structurally worsens, making it increasingly difficult to grow out of the problem. The post-war experience is the proof of concept that growth can solve the debt equation. The post-2008 experience is the proof of concept that stagnation cannot.
The compounding cost of debt servicing. For a decade after 2008, the UK could borrow at near-zero interest rates, making the debt pile relatively cheap to maintain. When the Bank of England raised rates to combat inflation, the cost of servicing government bonds surged. Approximately a quarter of UK government debt is held in index-linked gilts, where the payout rises directly in line with inflation. When inflation spiked into double digits in 2022 and 2023, the cost of servicing these specific bonds exploded. Index-linked gilts, designed to protect investors from inflation, became the mechanism through which rising prices transmitted directly into rising debt servicing costs for the Exchequer.
Demographic pressures and the welfare state. Even outside of crisis periods, the baseline cost of running the British state is increasing due to structural demographic change. As the baby boomer generation retires and life expectancy increases, the ratio of workers paying tax to retirees claiming benefits is shifting. This places immense, growing pressure on the state pension, protected by the triple lock, and on the NHS, both of which require continuously rising budgets just to maintain current service levels. The fiscal implication is a structural and compounding increase in baseline expenditure that no single parliamentary term can resolve.
It is a common misconception that the national debt is owed entirely to foreign nations. In reality, the UK government's debt, primarily issued as bonds known as gilts, is held by a complex mix of domestic institutions, the British central bank, and international investors. Based on data from the Debt Management Office and the Office for Budget Responsibility, the £2.98 trillion is distributed across five major categories, each with its own dynamics, risks, and structural implications.
The UK does not owe its debt to a singular foreign power. It primarily owes the money to its own central bank, the pension funds representing the retirement savings of the British public, and a diversified pool of global institutional capital. The politics of debt is vastly simpler than the economics of it.
The QE/QT squeeze is the least-discussed structural pressure on UK borrowing costs. When the Bank of England conducted Quantitative Easing, it bought gilts from the market, reducing the supply available to private investors and pushing yields down. This made government borrowing artificially cheap. Now, Quantitative Tightening reverses this: the APF is selling £70 billion in gilts into the market between October 2025 and September 2026. At the same time, the Debt Management Office is issuing new gilts to fund the government's ongoing borrowing requirement. Two entities are selling gilts into the same market simultaneously. More supply, at the margin, means higher yields. Higher yields mean higher borrowing costs for every new gilt the Treasury issues. The QT programme is structurally necessary to normalise monetary policy. Its fiscal side effect is that it makes the debt more expensive to refinance at precisely the moment the debt is at its largest.
The reversal of APF cash flows is an additional cost that receives little parliamentary attention. Between 2009 and 2022, QE generated £123.9 billion in cumulative net transfers from the Bank of England to HM Treasury. Since October 2022, that transfer has reversed: HMT is now paying into the APF because the Bank is paying Bank Rate on reserves (the policy rate it used to contain inflation) while holding gilts bought at the ultra-low yields of the QE era. The Bank is earning less on the gilts it holds than it is paying on the reserves it created to buy them. The taxpayer covers the difference.
The macro takeaway on who holds the debt is clarifying: Britain does not owe its financial future to Beijing or Riyadh. It owes it, primarily, to its own pensioners, its own central bank, and a diverse pool of global institutional capital that, for now, still considers UK gilts a credible store of value. The risk is not foreign domination of the debt. The risk is the structural cost of servicing it at a time when the economic growth that would organically dilute it remains insufficient.
The post-war precedent is instructive but not transferable by political will alone. Between 1945 and 1970, UK debt fell from over 200 per cent of GDP to around 60 per cent, not through austerity but through two decades of above-trend economic growth, rising employment, improving productivity, and a demographic dividend from a younger working population. Each of those conditions is either absent or structurally constrained in 2026. The demographic dividend has inverted. Productivity growth has stagnated. The planning and regulatory environment restricts the infrastructure investment that would generate it.
The path forward is not a fiscal secret. It is a supply-side programme that successive governments have acknowledged in theory and failed to deliver in practice: planning reform to unlock building, capital investment to raise productivity, workforce participation to expand the tax base. Until the denominator of the British economy grows faster than the interest accumulating on its numerator, the £3 trillion question has only one available answer, and it is not a comfortable one.
Add comment
Comments