Who Pays for 2027
In 2025 developing countries paid 1.4 trillion dollars to external creditors and received 126 billion in bilateral aid. The United Nations fund set up to compensate the countries worst hit by climate damage has approved one grant in its history, for twenty million dollars. This is the closing accounting of our 2027 edition, and it is arithmetic rather than argument.
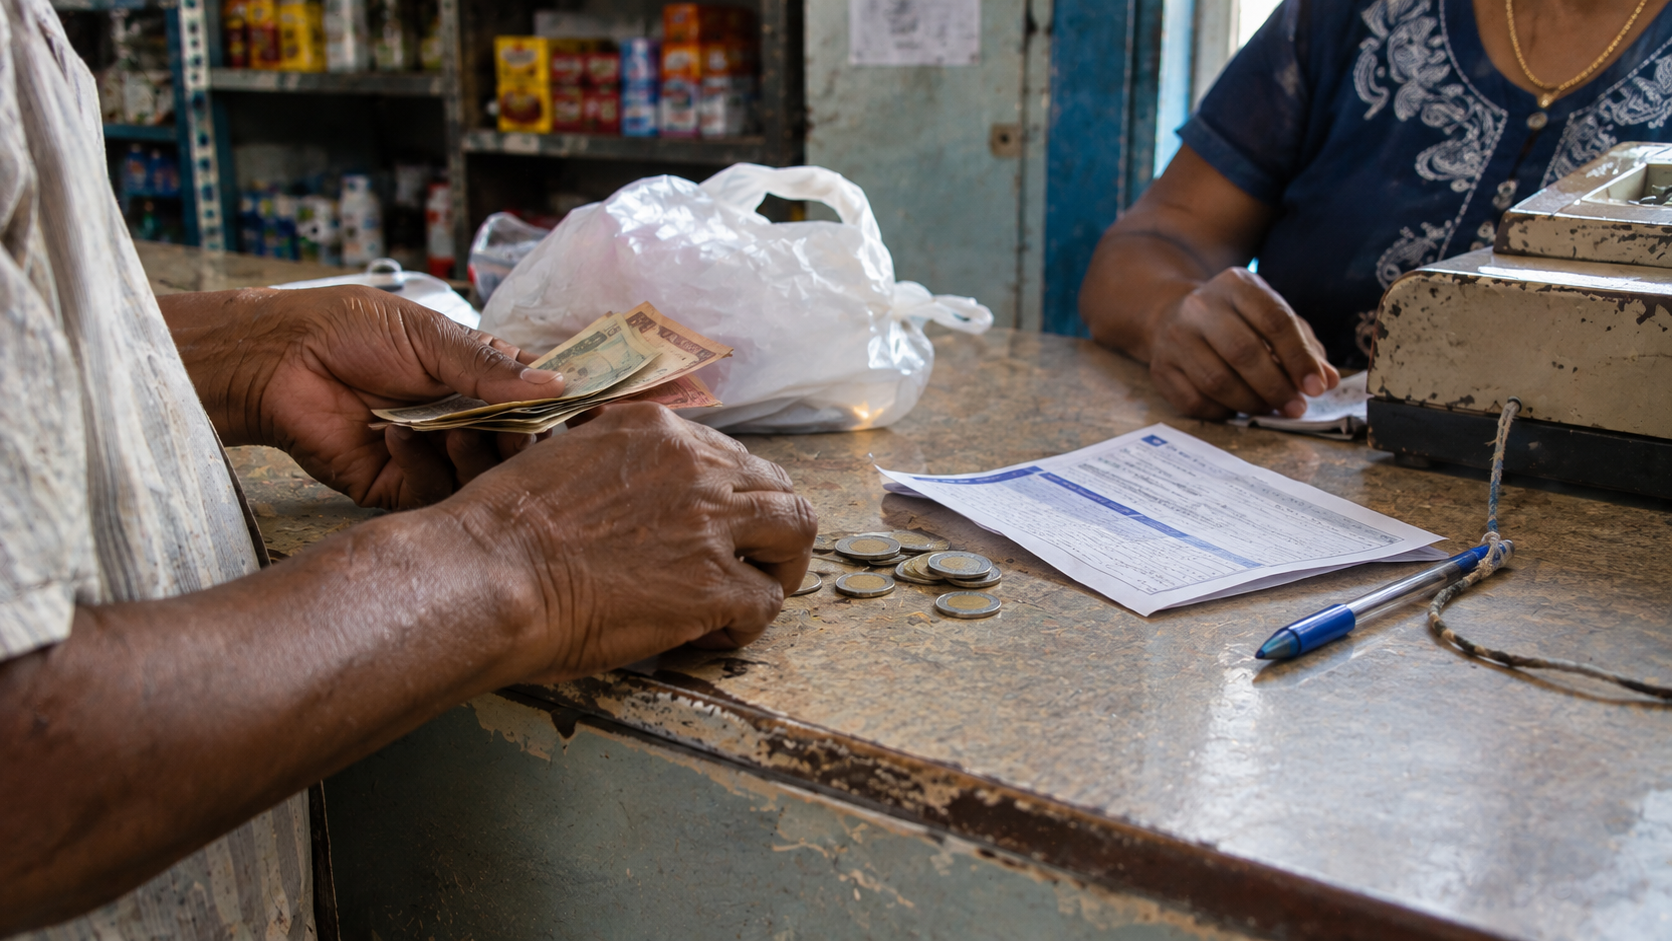
Twenty-five articles in this edition asked separate questions. Who finances a peace mission in the Sahel. Who absorbs the cost of cheap bread in Mauritius. Who holds the grain that southern Africa will need in April. Who covers a house in Seychelles that no insurer will write. Who pays for a Maldivian bondholder to be made whole.
They kept producing the same answer, and I did not set out to write an edition with a thesis. The answer arrived on its own, through the arithmetic, which is the only way an answer of this kind is worth anything.
I want to start by correcting myself, because the obvious version of this argument is wrong and I believed it until the research came back.
The familiar claim is that money flows from poor countries to rich ones. For three years that was literally true. In 2024, net transfers on long-term external debt to low and middle income countries ran at minus 118.4 billion dollars: these countries paid their creditors that much more than they received.
In 2025 it reversed.
So the sentence "the money flows the wrong way" can no longer be written without qualification, and anyone writing it in 2027 will be corrected by a reader holding the World Bank's November report.
What matters is how the reversal was achieved. Multilateral banks increased their lending, which is a genuine good and I will return to it. And sovereigns went back to the bond market, issuing 250.6 billion dollars of state-backed paper in 2025, a rise of almost 35 per cent. The average interest rate paid by the poorest eligible countries to private creditors that year was 8.2 per cent, the highest since 1989, and 9.4 per cent on new sovereign bonds. Some of that borrowing was collateralised at between 133 and 198 per cent through total return swaps.
The flow turned positive because the borrowing got more expensive. That is not a recovery. It is a more costly version of the same problem, and the bill arrives later, which is precisely why it belongs in an article about 2027.
Money moved back toward poor countries in 2025 at the highest price charged since 1989. We should be careful about calling that an improvement.
There is a second reason to be careful with the aggregate, and it is arithmetic rather than interpretation. A total can turn positive while most of its members do not. In 2024, 53 of 110 developing economies individually paid their external public creditors more than they received. The swing into surplus in 2025 was concentrated in the ten largest middle-income bond issuers, which are precisely the countries least likely to need it. For a Malawi or a Honduras, nothing reversed.
And the component that turned the aggregate was not official generosity. Net transfers from bilateral official creditors, the governments that make speeches about development partnership, were negative in 2025, and across the three years to 2024 they amounted to a cumulative two and a half billion dollars across every non-Chinese developing country on earth. That is not a programme. It is a rounding error with a communications budget.
Five hundred billion dollars a year. For comparison, every donor government on earth gave 174.3 billion in total aid in 2025. The interest premium charged for being poor is roughly three times the entire global aid budget.
That premium has a measurable destination inside national budgets. Fifty-one developing countries now spend more on net interest than on education or on health. The populations of those countries total 3.7 billion people, up from 2.5 billion in 2010, and include 65 per cent of everyone living in Africa.
Mauritius, as the previous article in this edition set out, pays 83 million rupees a day in interest and this year will spend more on servicing debt than on schools for the first time in its history. It is not an outlier. It is the median.
Here is the whole argument in one chart. These are the sums that moved in and out of the developing world in a single year, drawn to the same scale.
Read the top four bars and the bottom six together, because that is the finding. The developing world paid 1.4 trillion dollars in debt service and received 126 billion in bilateral aid. Its own migrants sent home 687 billion, which is five times what every donor government gave bilaterally and fifteen times the net transfer on all its external debt. African governments raised 572 billion from their own taxpayers.
The Global South finances the Global South. Everything else is a rounding error on its own balance sheet.
One item in that chart deserves its own treatment, because of what it was created to do.
Three years after it was agreed, the institution created to compensate countries for climate damage they did not cause holds 486 million dollars, has spent 20 million, and faces verified demand of 2.8 billion. Forty-one per cent of what was promised has not been handed over.
For scale, the gap between what was pledged and what was paid, 337 million dollars, is smaller than the sum Nigeria's government will pay in interest in about nine days.
The United Nations response to this has its own logic. Rather than report a collapsing coverage ratio, the humanitarian system cut the size of what it asks for: global appeal requirements fell from 49 billion dollars in 2024 to 35 billion in 2026, a reduction of 23 per cent, alongside a new category of "hyper-prioritised" need that excludes tens of millions of people from the count. Coverage duly improved from 19 per cent to 41 per cent. Almost all of that improvement is the denominator.
The shortfalls behind the average are where the money actually fails to go. Niger's appeal is 15.6 per cent funded. Burkina Faso's is 18.2 per cent. Mali's is 21.7 per cent. The Syria regional plan is at 11.5 per cent.
There is one more number worth sitting with. Of the 2.8 billion dollars requested, 1.7 billion came from small island states and least developed countries, which is to say from the places with the least capacity to prepare a funding application and the most reason to need one. They did the work. The money is not there.
None of this is how the cost actually reaches a household, which is the part that interested me most across the year's reporting. It reaches them through four devices, and each is designed, or has evolved, to be difficult to see.
The first is cross-subsidy. Mauritius funds cheap rice, flour and cooking gas by taking 3.7 billion rupees out of the retail price of petrol and diesel. A motorist pays for a loaf and no document anywhere presents it that way.
The second is the parastatal balance sheet. Rather than appear as an expenditure line, the subsidy sits inside a state trading company which borrows to carry it: in the Mauritian case 8.1 billion rupees of foreign currency loans, negative equity and a cash position that halved in nine months. Nigeria's national oil company absorbed 4.5 trillion naira, equal to 2.2 per cent of GDP, before the subsidy was removed in 2023. Angola's Sonangol saw its debt rise from two billion dollars to over seven billion in a year.
The third is the insurance deductible. Where cover has not been withdrawn it has been rewritten: a ten per cent excess on every cyclone claim in Mauritius, premium rises of twenty to thirty-five per cent across the Caribbean in a year when global reinsurance fell by a sixth. Globally, 62 per cent of natural catastrophe losses in 2023 were uninsured, and above 85 per cent across most of Africa.
The fourth is the exchange rate, which is the most regressive of all because it needs no legislation. Nigeria's adjustment from 461 to around 1,350 naira against the dollar pushed food inflation past 40 per cent and poverty to 63 per cent. Ethiopia's birr lost about 64 per cent of its external value after the float of July 2024. In the Maldives, where there has been no devaluation at all, dollar rationing at the official peg forces importers onto a parallel market thirty to forty per cent worse, which is a tax on every imported item collected without anyone voting for it.
What unites the four is that each converts a political decision into a technical one. Raising a tax requires a parliament. Widening an insurance excess requires an actuary. The first is contested, reported and occasionally lost at an election. The second is a line in a document nobody reads, and it moves the same money.
An article that stopped there would be dishonest, because real things are being provided and some of them are large.
The most important is IDA, the World Bank's concessional arm, replenished in December 2024 at a record 100 billion dollars for the three years to June 2028, lending to 78 countries at between zero and 2.7 per cent over thirty to fifty years. That is the single largest flow of genuinely cheap money into poor countries and it deserves more attention than it gets.
Multilateral lending as a whole grew by 131.3 billion dollars in 2025 and was the main reason net transfers turned positive. Donor core contributions to the World Bank rose 6.4 per cent and to the regional development banks 11.9 per cent, in the same year bilateral aid collapsed, which tells you something about where governments place their confidence. Balance sheet reforms across the multilateral banks have created up to 150 billion dollars of additional lending headroom over a decade. Four countries have completed debt restructurings under the G20 framework: Chad, Zambia, Ghana and Ethiopia.
And the special drawing rights rechannelling is real, if smaller than advertised. Sixty billion dollars has been channelled to the concessional trust, supporting 39 billion in interest-free commitments across 57 countries. An independent audit found that of 96 billion dollars formally transferred, reserve and buffer requirements left only 55 per cent lendable, commitments reached 38 per cent, and cash actually disbursed reached 24 per cent. Twenty-four per cent of a good idea is still a good idea. It is not the figure that was announced.
The question in the title has a factual answer and it is not the one I expected to write.
I expected to find that rich countries extract from poor ones, and for three years to 2024 the aggregate numbers said exactly that. They no longer do. What the 2025 accounts show instead is something less dramatic and more durable: the Global South is not primarily being drained by the North. It is financing itself, at a price set elsewhere.
Its own migrants send home five times what every donor government provides bilaterally. Its own taxpayers fund the overwhelming majority of its public spending, from tax bases of 16 per cent of GDP in Africa against 34 per cent in the rich world. When external finance falls short, it borrows at home: Kenya is funding 89 per cent of this year's deficit domestically, the Maldives 63.5 per cent, and across developing countries the external share of public debt has fallen from 53 to 44 per cent in six years. That is sovereignty of a kind. It is also the reason a Kenyan or Maldivian bank now holds an enormous share of its assets in its own government's paper, which is a vulnerability nobody is pricing.
That shift carries a risk this edition has not covered and should. When a government borrows at home rather than abroad, its banks end up holding its debt. In the Maldives, domestic banks hold 40 per cent of their total assets in sovereign paper, financial corporations 66 per cent, and the monetary authority 42 per cent. In Kenya, domestic debt has reached 55.8 per cent of the total and domestic interest alone costs 859.83 billion shillings a year. A banking system that large relative to its own sovereign has no independent judgement left to exercise about that sovereign. The bank cannot decline, and if the state falters the banks fail with it. Borrowing at home removes the exchange rate risk and replaces it with a concentration risk, and only one of those gets reported.
So the honest answer to who pays for 2027 is: the same people who paid for 2026, out of their wages, their remittances, their fuel receipts, their insurance excesses and the purchasing power of currencies they do not control. The external contribution to that effort is real, concentrated in the multilateral banks, and small relative to the task.
What strikes me, finishing this edition, is not the unfairness of it, which is familiar and which I have no new argument about. It is the invisibility. Not one of the four mechanisms above appears in a budget as a line a voter could find. A cross-subsidy is in a fuel price. A parastatal deficit is in a company's accounts. A deductible is on page nine of a policy. A depreciation is in the price of rice. Every one of them transfers real money from households to creditors, and not one of them requires a vote.
That is the finding of the year, and it is the one I would ask you to carry into it: the bill for 2027 is already written, already allocated, and almost entirely invisible to the people paying it.
Our next edition will be marking the six calls in the previous article against what actually happens. I would encourage you to hold us to them.
Data notes: Net transfer, debt service, disbursement, interest rate, remittance and multilateral stock figures are from the World Bank's International Debt Report 2026, published 4 November 2026, covering 119 low and middle income countries. Interest burden, spending comparison, effective rate and the 500 billion dollar counterfactual are from UNCTAD, A World of Debt 2026, published 7 October 2026, with per capita spending at a 2023 reference year. Neither publication prints an aggregate 2027 net transfer projection, because that figure depends on disbursements not yet contracted, and none is estimated here. Aid figures are from the OECD Development Assistance Committee preliminary release DCD(2026)8, with the United Kingdom's trajectory from the Foreign, Commonwealth and Development Office statistical release of 17 September 2026 and the French 2027 figure from the draft finance bill of October 2026. Humanitarian funding and appeal coverage are from the UN OCHA Financial Tracking Service monthly report of 31 August 2026, and the 2026 coverage figure is stated alongside the reduction in requirements because the two cannot be read separately. Loss and Damage Fund figures are from the Board's third annual report, document FCCC/CP/2026/7, published 19 October 2026 with data as at 31 July 2026, and the first allocation from board proceedings of 22 October 2026. Special drawing rights figures are the IMF's own through 15 September 2026, with the disbursement audit from the Center for Global Development of 23 July 2025. The IDA21 replenishment figure is from the World Bank announcement of 6 December 2024. Tax to GDP ratios are from the OECD global revenue statistics series for Africa, Asia-Pacific, Latin America and the Caribbean, and the OECD itself. Mechanism figures are drawn from the primary sources cited in the individual articles of this edition: the Mauritian State Trading Corporation annual report and National Assembly Hansard of 15 April 2025, Nigerian and Angolan state oil company accounts, Mauritian and Caribbean insurance policy documentation, the Financial Stability Board of 16 January 2025, and IMF country reports for Nigeria, Ethiopia, Egypt and the Maldives. This article corrects an assumption held by this publication before research: that aggregate net financial transfers currently run from developing countries to developed ones. That was true in 2022, 2023 and 2024 and ceased to be true in 2025, and the correction is made in the text rather than omitted.
Content Protected
This article is the original work of The Meridian and is protected by copyright. Please link to it rather than reproducing it.