The Global South Inherits Every Crisis It Did Not Cause
Developing countries owe $12.3 trillion in external debt, pay it at record-high rates, watched their currencies lose 40% without any change in domestic policy, and received 7% of the global compensation mechanism promised to help them. A forensic account of how maximum exposure is built into the architecture, not caused by the people living inside it.
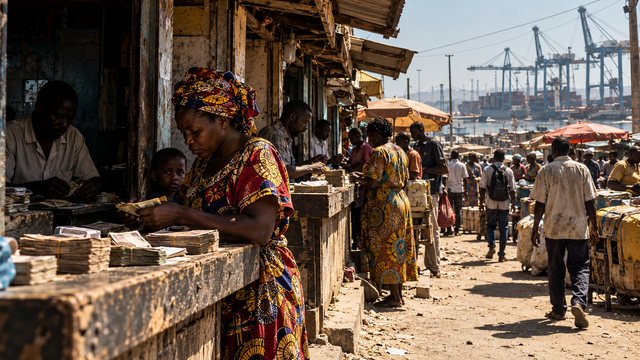
The phrase "maximum exposure" belongs to financial risk management. An institution with maximum exposure to a counterparty will absorb the greatest damage when that counterparty fails. What risk managers rarely model is a scenario in which the counterparty does not fail but simply makes a decision. The Global South has maximum exposure to the monetary policy decisions, fiscal choices, and financial conditions of wealthy economies whose institutions it had no hand in designing and whose democratic processes it has no access to. This is not metaphor. It is structural. And in 2025 and 2026, for the first time in more than five decades, the accumulated cost of that exposure has been fully measured.
$12.3 trillion — total external debt of developing countries, 2025 (UNCTAD)
$1 billion per day — Global South debt service to external creditors, 2024 (Global Sovereign Debt Monitor)
$741 billion — net financial outflows from low- and middle-income countries, 2022–2024 (World Bank)
90% — share of Global South external debt denominated in foreign currency, principally US dollars
7% — share of pledged SDR compensation mechanism actually disbursed by March 2026 (UNCTAD)
The dollar's role as the world's reserve currency was formalised at Bretton Woods in 1944. The United States held approximately two thirds of the world's gold reserves at that moment and used that position to establish the dollar as the anchor of the international monetary system. Richard Nixon ended the gold convertibility of the dollar in August 1971. The dollar's reserve status, and the structural advantages it conferred, did not end with it. Trade continued to be invoiced in dollars. Debts continued to be denominated in dollars. Foreign exchange reserves continued to be held in dollars. One country's central bank retained, by institutional inertia and the absence of a credible alternative, effective control over the cost of money for the entire Global South.
Almost 90% of Global South external debt is denominated in foreign currency, principally US dollars. The figure is not an accident of poor planning by debtor governments. It reflects the structure of international capital markets, which have for eight decades priced and transferred risk in a single currency. A government in Accra or Colombo that wants access to international bond markets issues dollar-denominated debt not as a choice but as the price of entry. When the Federal Reserve raises its benchmark rate, the real cost of servicing that debt rises in local currency terms the same afternoon. No vote was cast. No parliament was consulted. The adjustment mechanism runs automatically.
In 2024, Global South governments paid external creditors more than one billion US dollars every single day. It was the highest level on record. Interest costs on long-term external debt rose a further 14% in 2025. For sub-Saharan Africa, average interest rates on new government bonds reached almost 8% in 2025, compared with approximately 4% in 2020. Countries that borrowed five years ago at pre-pandemic rates are refinancing into a radically different cost environment, not because their fiscal positions deteriorated, but because the global interest rate environment shifted in Washington and Frankfurt.
"Debt service grew 81% between 2015 and 2025. Debt stocks grew 65%. Countries are paying more than they borrowed, and the gap is widening every year."
The aggregate consequence is stark. Between 2022 and 2024, low- and middle-income countries recorded net financial outflows of $741 billion — the largest negative debt-related transfer in more than 50 years of recorded data. In 2024 alone, they paid $205 billion more in principal and interest than they received in new financing. This was the third consecutive year of net outflows. The direction of capital movement, from the countries that can least afford it to the creditors who need it least, is not a market correction. It is a structural feature of the system as designed.
At the country level the pressure is most visible in its extremes. Zambia and Sri Lanka, both undergoing debt restructuring, faced debt service obligations exceeding 50% of government revenues under original loan terms. Lebanon and Laos crossed 70%. Of 89 monitored low- and middle-income countries, 21 spent over 20% of government revenues on interest payments alone in 2024, up from 9 countries in 2017. In low-income countries, interest now accounts for more than half of total external debt service. The fiscal space left for health, education, infrastructure, and the social provisioning that might prevent the kind of unrest documented in earlier layers of this edition is being consumed by servicing obligations on debts that were themselves partly a product of absorbing previous external shocks.
The second transmission mechanism is the exchange rate. A stronger US dollar raises the local-currency cost of all dollar-denominated debt service without any change in the debtor government's own policy. Since 2017, one quarter of 89 monitored low- and middle-income countries have seen their currency depreciate more than 40% against the US dollar. The depreciation did not follow fiscal mismanagement in most of these cases. It followed shifts in global risk appetite, capital outflows triggered by Federal Reserve tightening, and the broad dollar appreciation that accompanies periods of US monetary policy tightening.
The political economy of currency depreciation is particularly punishing in countries with high commodity import dependence. A 40% depreciation of the exchange rate does not reduce the cost of imported food, fuel, or medicine by 40%. It raises it. The population that had no role in the international monetary decisions that drove the depreciation is the population that pays for it at the petrol pump and the grain market. This is the mechanism by which global monetary policy transmits directly into domestic cost-of-living pressure in countries that have no seat at the table where the decisions are made.
The Global Sovereign Debt Monitor 2025 assessed 198 countries and classified 47 as very heavily burdened and 28 as heavily burdened. Approximately 70% of sub-Saharan African countries — 34 of 49 — are in one of those two categories. Over 60% of low-income countries are heavily or very heavily burdened. Taken together, the people living in the 47 most burdened countries include approximately 231 million in extreme poverty — roughly 18% of their combined population, more than twice the global average. The debt load and the poverty rate are not independent variables. Countries spending 15 to 20% of government revenue on external debt service have proportionally less to spend on the public services that determine whether poverty deepens or recedes.
Private creditors now hold approximately 60% of outstanding claims against 130 Global South countries. Multilateral creditors hold approximately 29%. The shift from multilateral to private creditor dominance matters because private creditors operate under different incentive structures. They are not mandated to consider development outcomes. They are mandated to maximise returns. When a country requests restructuring, private bondholders have historically been slower to agree than multilateral lenders, prolonging the period of distress. The Common Framework for debt relief, established in 2020, has processed a small number of cases across four years. The architecture of creditor negotiation has not kept pace with the architecture of debt accumulation.
In 2021, wealthy nations pledged to rechannell $114.7 billion in Special Drawing Rights to support developing countries absorbing the compound shock of the Covid-19 pandemic, inflationary pressure, and the debt burden consequences of the global interest rate cycle. SDRs are a reserve asset allocated by the IMF; rechannelling them requires a technical process of transfer from wealthy country allocations to developing country needs. By the end of March 2026, $8 billion had been disbursed. That is 7% of the stated commitment.
"$114.7 billion was pledged. $8 billion was delivered. The mechanism designed to compensate the Global South for crises it did not cause delivered seven cents of every promised dollar."
The SDR figure is important not only as a measure of disbursement failure but as a measure of institutional intent. The compensation mechanism was announced in the language of solidarity. It was executed at 7%. This gap between announced commitment and actual disbursement is not unique to the SDR mechanism. It repeats across climate finance pledges, official development assistance targets, and technology transfer commitments. The pattern is sufficiently consistent that it has ceased to be anomalous. It is the expected ratio between what is promised and what is delivered, and it is itself a structural feature of the system that produces maximum exposure.
Developing countries' external debt reached $12.3 trillion in 2025. Debt service grew 81% between 2015 and 2025 while debt stocks grew 65%, meaning the cost of the debt is outpacing the debt itself. The standard explanation attributes these figures to fiscal mismanagement, poor governance, or the consequences of domestic political instability. The data do not support that explanation as a primary cause. Countries that borrowed at market rates available in 2020 are servicing those debts at 2025 rates. Their currencies have lost 40% of their value against a dollar they do not issue. The compensation mechanism has paid 7% of its commitment. The architecture that produced these outcomes was not designed in Lagos or Dhaka. The population absorbing those outcomes lives there.
- UNCTAD, External Debt Sustainability and Development 2026 — unctad.org
- Global Sovereign Debt Monitor 2025, erlassjahr.de / Misereor — misereor.org
- World Bank, International Debt Report 2025 — worldbank.org
- IMF, Debt Vulnerabilities and Financing 2025 — imf.org
- Institute of International Finance, Capital Flows Tracker, 2022–2026 — iif.com
- OECD, Global Debt Report 2026: Sovereign Borrowing Outlook — oecd.org
- BIS Papers No. 171, Capital Flows, Exchange Rates and Financial Conditions in EMEs — bis.org
- Oxfam International, The Power of the Creditor, 2023 — oxfam.org
Analysis and editorial production: The Meridian Desk. All data verified against primary sources at time of publication. November 2026.