The Price of Food in 2027
The Pacific is warmer at this point in the year than it has ever been recorded. The heat takes three to five months to reach the atmosphere, and another season to reach the harvest. By the time it arrives at a market stall, nobody will call it weather.
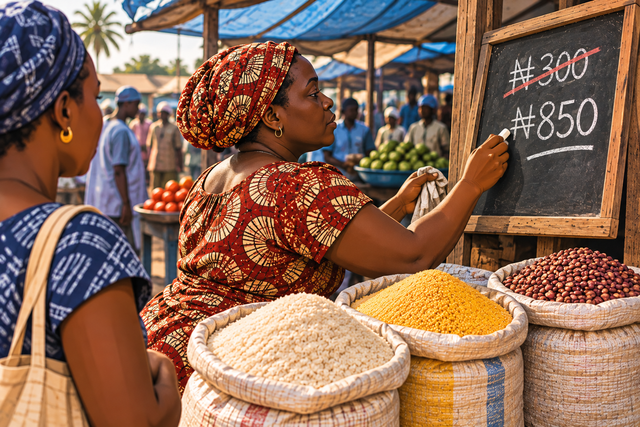
A stallholder rubbing out a chalked price and writing a higher one is not making a forecast. She is reporting one that has already happened somewhere upstream, weeks or months earlier, in a place she has never been and on a market she has no access to. By the time the number reaches her slate it is no longer a projection or a probability. It is simply what the sack cost her, plus what she needs to survive the week.
Almost everything that will happen to the price of food in 2027 is already determined. Not in the sense that the figures are fixed, but in the sense that the forces which will produce them are in motion now and cannot be recalled. The ocean has already warmed. The planting decisions for the coming season are already being made against it. The fertiliser has already been priced, or not bought. What remains is the arithmetic of transmission, and transmission takes time.
That time lag is the single most useful thing to understand about the year ahead, because it is what separates a story the world has already stopped covering from a bill that has not yet arrived.
The Oceanic Nino Index is the standard measure of El Nino strength, a three month average of sea surface temperature anomalies in the central Pacific. For August to October 2026 the United States Climate Prediction Center puts it at 2.5 degrees Celsius above average.
That figure requires context to mean anything, and the context is startling. In the entire record maintained by the Climate Prediction Center going back to 1950, only two other years have recorded an August to October value of 2.0 or higher. Those years were 1997 and 2015, and the events that followed them are the two strongest El Ninos ever measured. Both of those events, at this same point in their development, were running half a degree cooler than the Pacific is running now.
The 1997 and 2015 events went on to peak at 2.4 and 2.6 degrees respectively, in the November to January window. The current event is at 2.5 before that window has opened. The Climate Prediction Center gives better than an 83 per cent probability that a strong to very strong event persists through to March 2027.
It is worth saying plainly what we are not claiming. A warmer index does not mechanically produce a worse harvest, and the relationship between ocean temperature and any particular country's rainfall is probabilistic rather than fixed. But the two previous events at this magnitude both produced measurable global food price consequences, and the current one is arriving on a system with less slack in it than either of those had.
The heat is already in the water. Everything after this point is a question of how long it takes to reach a kitchen.
El Nino's peak effect on global atmospheric temperature trails the ocean by three to five months. That alone moves the consequences of a late 2026 peak squarely into the first half of 2027. But the atmosphere is only the second link in the chain, and the chain is longer than most coverage allows for.
This is why El Nino is persistently under-covered as an economic event. The news cycle attends to the ocean, which is dramatic and measurable, and has moved on long before the consequence arrives. By the time food prices move in a net importing country, the causal chain is eighteen months long and runs through four different domains. No politician is going to be held to account for a sea surface anomaly recorded the year before last.
In October 2026 the FAO Food Price Index stood at 133.9 points. It had eased by 1.2 per cent from September, which produced a small run of reassuring coverage. It was also 5.9 per cent higher than a year earlier, which produced rather less.
The headline number conceals more than it reveals, because the basket is not what any particular household buys. The sub-indices for the same month tell a sharply different story depending on what is on your shelf.
Vegetable oil at 199.2 points is close to double the 2014 to 2016 baseline and far above every other component. For a household in a country that imports its cooking oil, and most of the Indian Ocean does, the official statement that food prices eased last month is simply not a description of their week. The headline index is an average of things that are not substitutes for one another.
This gap between the published index and the experienced price is not a measurement error. It is a structural feature of how food inflation is reported, and it is the reason that governments can accurately state that prices are falling while an accurate household budget shows the opposite.
A country that grows most of what it eats absorbs a global price shock partially. A country that buys most of what it eats absorbs it fully, and then absorbs it a second time through the exchange rate.
Mauritius imports more than 80 per cent of the food it consumes. There is no domestic production base large enough to substitute, no strategic reserve capable of smoothing a sustained increase, and no monetary instrument that addresses imported cost-push inflation. When the landed price of rice or cooking oil rises, the rupee cost rises with it, and then rises further if the rupee weakens against the dollar in which the cargo was priced.
This is the position of most small island economies and a great many coastal African states. It is also the position in which the policy toolkit is least useful. A central bank can raise rates against demand-pull inflation. It cannot raise rates against a failed harvest on another continent, and attempting to do so suppresses domestic activity while leaving the imported cost entirely untouched.
Interest rates are an instrument for an economy that is buying too much. They are useless against an economy that is paying more for the same amount.
The responses available to a net importing government facing a food price shock are well established and mostly disappointing.
Subsidies and price caps work immediately and cost fiscally, which in a year of heavy debt refinancing is precisely the resource that is scarce. They also tend to be universal rather than targeted, because targeting requires administrative capacity that is itself underfunded, so a substantial share of the money reaches households that did not need it.
Export restrictions by producing countries are the response that does the most damage. Each one is individually rational and collectively catastrophic: a government protects its own consumers by withholding grain, the global price rises further, and the next government does the same. The 2007 to 2008 food crisis was amplified considerably by exactly this sequence.
Strategic reserves work, and almost nobody holds enough of them, because a reserve is an expense in every year except the one in which it is needed. The economics of resilience are the economics of looking wasteful for a decade.
What is genuinely useful, and almost entirely absent from the policy conversation in small import-dependent states, is the boring work of reducing exposure before the shock: domestic production of the two or three highest-volume staples, storage capacity, and procurement contracts that fix price rather than leaving it to the spot market. None of this is achievable inside a single year, which is why 2027 will be managed rather than solved.
Three things will tell you early whether this is unfolding as described.
The first is the Climate Prediction Center's monthly ENSO discussion through to March. If the event decays faster than the current 83 per cent persistence estimate implies, the atmospheric consequence weakens and much of this article weakens with it.
The second is the first export restriction. One major cereal exporter imposing a levy or quota is the signal that the sequence has begun, and it generally precedes the retail price move by several months.
The third is the vegetable oil sub-index. It is the most exposed component, the most import-dependent for the countries this publication covers, and the fastest to move. It is already the highest reading in the basket by a wide margin.
None of this is a prediction of famine, and the distinction matters. It is a description of a cost that is already in transit, moving through a chain that takes a year and a half to complete, towards households that have no instrument to deflect it and no part in the processes that generated it. The stallholder will rewrite the number. She will also be the one asked to explain it.
Data notes: Oceanic Nino Index values from the United States National Oceanic and Atmospheric Administration, Climate Prediction Center, ONI version 6 historical table, which notes that the most recent values are estimates subject to revision for up to two months. Persistence probability from the Climate Prediction Center ENSO update of 2 November 2026. Food price index and sub-indices from the Food and Agriculture Organization of the United Nations, October 2026 release of 6 November 2026, indexed to a 2014 to 2016 base of 100. Mauritian food import dependence from Meridian research published in the September 2026 edition. Transmission intervals beyond the ocean to atmosphere lag are indicative and vary by crop, region and import exposure.
Content Protected
This article is the original work of The Meridian and is protected by copyright. Please link to it rather than reproducing it.