The South's Biggest Export Is People. The Door Is Closing.
Sub-Saharan Africa will supply more than three quarters of the world's working-age population growth to 2050. The countries that will need those workers are restricting entry now. And on every pound that does get sent home, a toll is charged that nobody has managed to bring down to target.
Of every two hundred dollars a worker sends home to sub-Saharan Africa, sixteen dollars and ninety-two cents does not arrive. It is taken in fees and exchange margins before the money reaches the person it was sent to. The World Bank has measured this every quarter for seventeen years. In the third quarter of 2025 the figure was 8.46 per cent, the highest of any receiving region in the world.
The internationally agreed target, signed up to by every government that signed the Sustainable Development Goals, is below 3 per cent by 2030. Sub-Saharan Africa is paying nearly three times that, and the deadline is four years away.
That toll is the small, measurable end of a much larger arrangement. The largest thing the Global South currently exports is not a mineral or a crop. It is labour. And 2027 is the year in which two contradictory forces acting on that export become impossible to ignore at the same time.
The demographic arithmetic is not in dispute and it is not close.
On the United Nations medium variant projection, sub-Saharan Africa will account for more than three quarters of the growth in the world's working-age population between now and 2050, adding roughly 625 million people aged 15 to 64. Over the same period, the working-age population of Japan and South Korea is projected to fall by a quarter to a third. The European Union's total population is projected to peak before 2029 and then decline, reaching 445 million by 2050 and 398.8 million by 2100.
The ratio of old to young in the rich world inverts entirely. In high and upper-middle income countries there is currently slightly more than one person aged 65 or over for every person aged 15 to 24. By 2050 there are projected to be nearly three. The OECD's average old-age dependency ratio is projected to reach 52 per cent by 2060, and above 70 per cent in the fastest-ageing members, with Japan approaching 81 per cent by 2050.
The shortages are not hypothetical either. In the year to August 2026 the United Kingdom recorded 702,000 unfilled vacancies, and NHS England carried around 100,000 vacant full-time equivalent posts in December 2025, a 6.7 per cent vacancy rate. In the euro area in April 2025, one in six industrial firms and one in four service firms reported a lack of labour as a factor limiting production. Japan's development agency estimates the country needs 3.56 million foreign workers by 2030 and 6.32 million by 2040, and projects a shortfall approaching a million against current inflow trends.
Set against that, here is what the receiving countries have actually done.
The United Kingdom raised the general skilled worker salary threshold from 26,200 pounds to 38,700 in April 2024, and again to 41,700 in July 2025.
In the same period the minimum skill level for skilled worker and health and care visas was raised from A-level equivalent to graduate level, with occupations below that confined to a temporary shortage list carrying no right to bring dependants. Taught master's students were barred from bringing dependants in January 2024 and care workers in March 2024. Overseas entry for care workers and senior care workers was closed entirely in July 2025.
The Medical Training (Prioritisation) Act received royal assent in March 2026, legally prioritising UK medical graduates over international ones for NHS training places, alongside a stated target of cutting international NHS recruitment from 34 per cent to under 10 per cent by 2035.
And announced on 2 November 2026, rolling out through 2027: the end of near-automatic settlement after five years on work routes, replaced by requirements covering criminal record, B2-level English, no outstanding debt to the NHS or the tax authorities, sustained national insurance contributions, and a household income threshold of 25,142 pounds for dependants. Time spent on student, graduate and youth mobility visas will no longer count towards settlement at all.
Canada has gone further in a different direction. Its 2027 to 2029 levels plan fixes permanent resident admissions at 380,000 a year, below 1 per cent of population, and for the first time caps temporary inflows explicitly: 220,000 new temporary workers and 150,000 new international students in 2027.
Australia set its permanent migration programme at 185,000 places and has raised its skilled income thresholds every year, reaching 79,423 Australian dollars for the core skills route for nominations lodged from July 2026.
The United States introduced a 100,000 dollar payment per new H-1B petition for beneficiaries outside the country by presidential proclamation in September 2025, renewed in September 2026 after a district court vacated the implementing guidance in June.
Every one of those governments has published projections showing it will need more workers than it has. Every one of them has spent the last three years making it harder to get in.
It would be easy, and lazy, to call this simple contradiction. It is better understood as a timing mismatch between two political clocks.
The demographic bill arrives over twenty-five years. Electoral cycles run over four or five. A politician who admits workers today pays an immediate political cost and collects a fiscal benefit that accrues to a successor two or three governments away. The incentive structure reliably produces restriction now and shortage later, and it will keep producing it regardless of which parties are in office.
The second thing to notice is where the restriction lands. Salary thresholds, graduate-level skill requirements and dependant bans do not close the door evenly. They close it hardest on exactly the workers whose home economies are poorest, because a salary threshold set in sterling is a far higher bar for someone coming from a labour market where wages are a fifth of British levels. The routes that remain open are those for the already advantaged.
And the care sector is the clearest case of the trap closing on itself. Britain shut overseas entry for care workers in July 2025 while its population ages faster than its care workforce grows. The shortage does not disappear because the visa route did.
While the door narrows, the cost of using it remains stubbornly high.
The World Bank's Remittance Prices Worldwide survey covers 358 corridors across 48 sending and 102 receiving countries. In the third quarter of 2025, the global average cost of sending 200 US dollars was 6.36 per cent. Sub-Saharan Africa, at 8.46 per cent, was the most expensive receiving region in the world.
The spread in that chart is the finding. A commercial bank charges 14.99 per cent. A digital-only money transfer operator charges 3.54 per cent. The average of the three cheapest services on any given corridor, which the World Bank publishes as its SmaRT index, is 3.29 per cent, within a fraction of the international target.
In other words the problem is solved, technically. It costs 3.29 per cent to send money home today if you can reach the right service. The 8.46 per cent that sub-Saharan Africa actually pays is the price of not being able to: of cash corridors, of thin competition, of informal recipients without bank accounts, of regulatory compliance costs that fall hardest on the smallest transfers.
Thirteen corridors worldwide recorded average costs above 20 per cent in the third quarter of 2025. Nine of them originate in sub-Saharan Africa, including intra-African routes. The most expensive place to send money from Africa is another part of Africa.
No institution publishes an observed figure for the total taken in remittance fees worldwide, and the reason is technical: balance of payments statistics record remittances net of the fees already deducted, so the money never appears as a recorded flow.
What can be done is an arithmetic illustration, which we set out as our own calculation rather than anyone's published figure. Applying the World Bank's global weighted average cost of 5.04 per cent to the 656 billion dollars that flowed to low and middle income countries in 2023 gives roughly 33 billion dollars. Applying the simple average of 6.36 per cent gives roughly 42 billion.
Whichever end of that range is nearer the truth, the sum is of the same order as the entire development assistance budget of a large donor economy, taken from the poorest senders in the world, in increments of twelve to seventeen dollars.
One more set of numbers belongs here, because an article about labour as an export should not leave them out.
The International Organization for Migration recorded at least 7,667 deaths and disappearances of migrants worldwide in 2025, about twenty-one a day. That was down from nearly 9,200 in 2024, which is the only encouraging sentence in this section.
Within that total, more than 3,000 deaths were recorded in Asia, the deadliest year on record there for a third consecutive year. The Eastern Route from the Horn of Africa to Yemen and the Gulf recorded 922 deaths, up from 558 in 2024, mostly Ethiopians. The Mediterranean recorded at least 2,185, and the Atlantic route to the Canary Islands 1,214. Since 2014 the project has recorded 86,671 deaths globally.
These figures belong in an economic article because they are a cost of the same transaction. A labour market that is formally restricted and economically necessary generates an informal route, and the informal route has a price measured in people.
Three things, and the first is the most consequential.
Britain's earned settlement rules roll out through 2027. They are the sharpest change of direction by a major receiving country in a decade, because they alter not just who may enter but whether entry leads anywhere. A work route that no longer reliably ends in settlement is a different product, and the response of prospective migrants to that change is the single best live test of how much the demographic bargain depends on the promise of permanence.
Second, remittance costs. The direction is right: the global average has fallen from 6.62 per cent a year earlier, and the share of corridors below 5 per cent has reached 83 per cent, against 17 per cent in 2009. Whether sub-Saharan Africa's 8.46 per cent converges or stays stuck is a measurable thing, published quarterly, and we have put it in the Scorecard.
Third, Canada's caps. For the first time a major receiving country has put explicit numerical ceilings on temporary workers and students, not just permanent residents. If that becomes the template, the quiet flexibility that temporary routes provided disappears, and the mismatch between demographic need and legal access gets considerably worse.
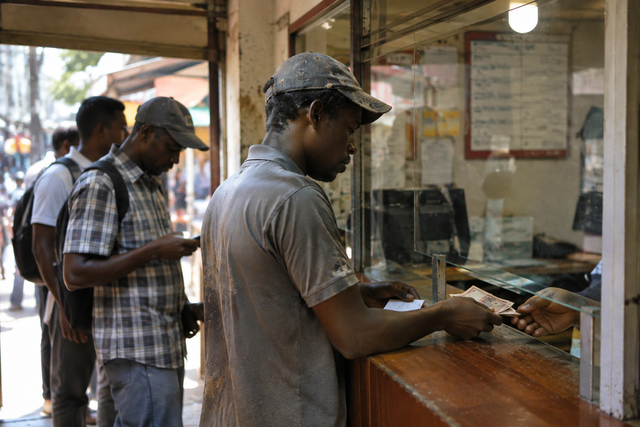
The man at the counter pushing notes through a gap under a glass screen is completing the last step of a transaction that began when his country could not employ him and another country would not quite admit him. He paid to get there. He is paying to send money back. The arrangement is not an accident of policy and it will not be corrected by one, because the countries that need him most have the least incentive to say so before the next election.
Data notes: Remittance costs from the World Bank, Remittance Prices Worldwide, Issue 54, September 2025, covering the third quarter of 2025, based on a price survey across 358 corridors; figures verified against the published report. The fee total of 33 to 42 billion dollars is a Meridian calculation applying World Bank average cost rates to the 656 billion dollar flow to low and middle income countries recorded in World Bank and KNOMAD Migration and Development Brief 40 of June 2024; it is not a published figure and the two World Bank cost series give materially different answers. Demographic figures are projections from the United Nations World Population Prospects 2024 medium variant, with the working-age share drawn from World Bank analysis of that projection, and EU population figures from Eurostat EUROPOP2025 via the European Commission 2026 Demography Report. Labour shortage figures from the Office for National Statistics vacancy survey of September 2026, the House of Commons Library briefing on international recruitment in the NHS workforce of March 2026, the OECD Employment Outlook 2025, and JICA projections for Japan. Migration policy changes from UK Home Office statements of changes and announcements, Immigration Refugees and Citizenship Canada levels plans, the Australian Department of Home Affairs, and United States presidential proclamations. Migrant deaths from the IOM Missing Migrants Project, February 2026; the IOM states these are minimum counts.
Content Protected
This article is the original work of The Meridian and is protected by copyright. Please link to it rather than reproducing it.