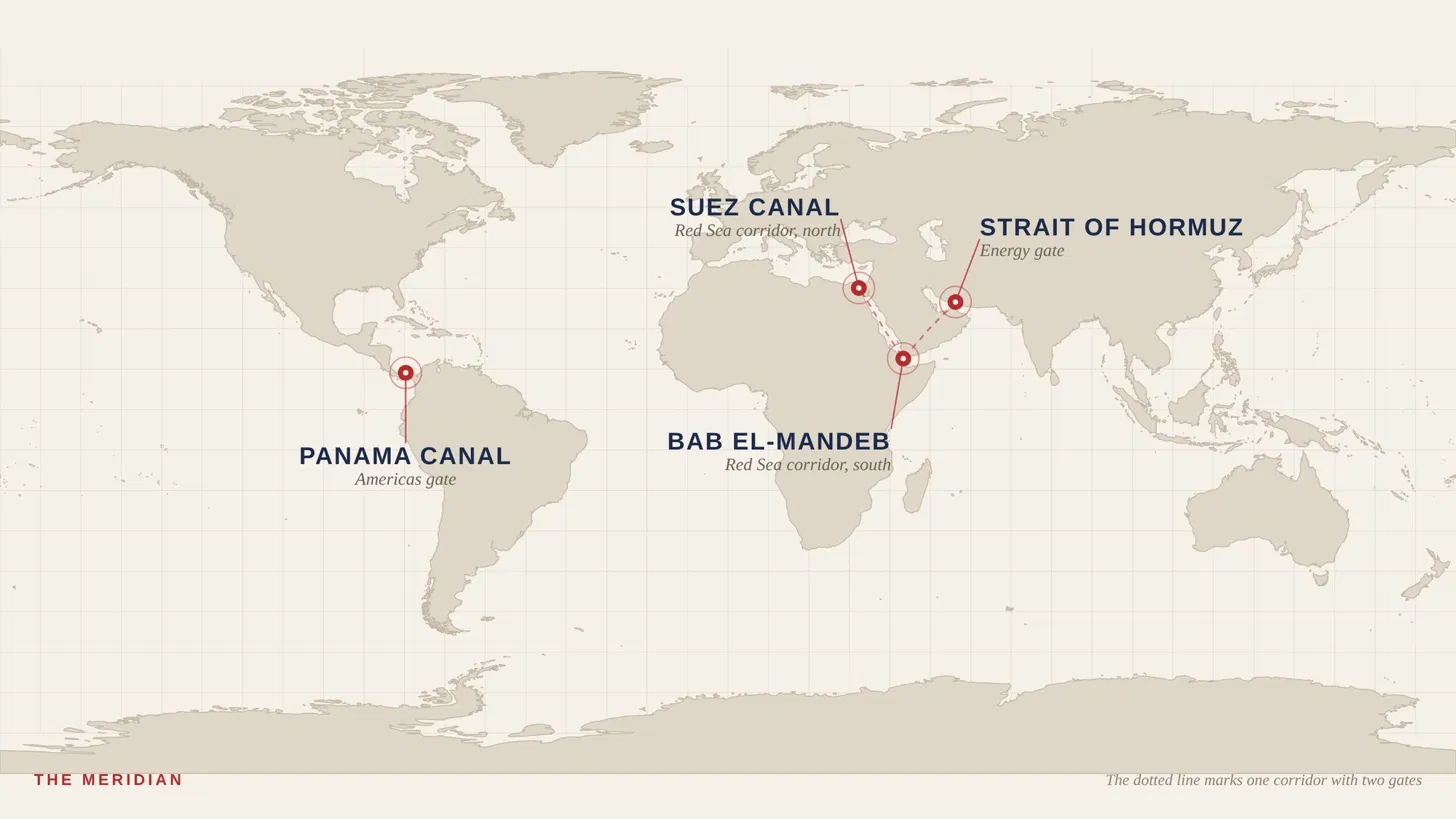
Four Stretches of Water Set the Price of Imports.
In the week to 12 November, fifty-three container ships transited the Suez Canal and one transited the Strait of Hormuz. The International Maritime Organization has counted 130 incidents in the Gulf since late February and at least twenty-five seafarers killed. Gulf crude exports are back at pre-war volumes. Almost none of it travels the way it used to.
On 10 November the United Kingdom Maritime Trade Operations agency reported a tanker struck northeast of Lima, on the Omani coast. The Islamic Revolutionary Guard Corps said separately that two tankers had caught fire after hitting naval mines on what it called an unauthorised route. Two days earlier a tanker managed by a company majority-owned by Abu Dhabi's national oil logistics arm caught fire off the same coast, and Iranian state media said three vessels had been hit that day.
The Washington Institute counted thirty-seven ships attacked in October, the highest monthly total since the war began on 28 February. There is little sign of it easing. On the same days, Brent crude touched a two-month low.
Those two facts belong in the same sentence, and understanding why is the subject of this article. The oil is arriving. The ships carrying it are being hit. Markets have priced the first and not the second, and the gap between them is where a chokepoint does its real work.
The Strait of Hormuz closed on 28 February 2026, when Iran shut it to foreign shipping after American and Israeli strikes. Within ten days the seven-day average of non-Iranian crude leaving the Gulf had fallen 72 per cent, from about 16.5 million barrels a day to 4.5 million.
Between 1 and 28 September 2026, at least 16.5 million barrels a day left the region again. On the headline measure, the disruption is over.
It is not over. What changed is the route.
Sixty per cent still crosses, but mostly on shuttle tankers that transfer their cargo to larger vessels in the Gulf of Oman rather than sailing through and onward. In May, 86 per cent of the crude that crossed Hormuz changed ships on the other side.
The rest goes by pipeline to a coast that is not inside the Gulf.
That is the whole mechanism of a chokepoint, visible in one chart. A country with a pipeline to the far coast keeps exporting. A country without one does not. Kuwait, Qatar and most of Iraq have no alternative, and Iranian crossings have been near zero since the American naval blockade was reimposed in July.
Gas has no pipeline at all. Qatar, which has no route out except through Hormuz, has been extending force majeure on its liquefied natural gas contracts and cancelling deliveries roughly once a month since the war began, after its Ras Laffan export plant was attacked and damaged in March. By late September it was still cancelling cargoes to Pakistan and Bangladesh through November, and to one Italian buyer until early December. The strait handled about a fifth of the world's liquefied natural gas supply last year. European and Asian gas prices are at roughly their highest since late 2022.
Note which customers lost their cargoes. Not the buyers with the deepest reserves or the strongest alternative contracts. The price-sensitive importers in South Asia, who are the first to be cut when a supplier is rationing and the last to be restored.
The barrels arrive. They arrive by a longer route, on more ships, through more hands, at a higher insurance premium. Somebody pays for that, and it is not the tanker owner.
The Red Sea corridor has its own war. Attacks on commercial shipping from Yemen began in November 2023 and the corridor has not been normal since. In 2023 the Suez Canal earned a record 10.2 billion dollars. In 2025 it earned 4.1 billion.
The recovery is real and it is almost entirely an energy recovery. Oil tankers were 526 of the 1,340 vessels that transited in July, and 1,526 of the 3,580 that transited in the second quarter. They came back because Hormuz pushed Saudi crude west to Yanbu, and from Yanbu the way to Asia and Europe runs through the Red Sea.
Container lines did not come back. Overall canal volumes are running at roughly half pre-crisis levels, and container traffic is down by about four-fifths. In the week to 12 November, fifty-three container ships transited.
Two industries looked at the same water and reached opposite conclusions. Tanker operators accepted the risk because the alternative route had been closed by a different war. Container operators, whose cargo is more valuable per ship and whose schedules are built around reliability rather than a single cargo, mostly still go round the Cape of Good Hope.
It is worth naming the chokepoint that went the other way, because it shows the difference between a physical constraint and a political one.
Drought cut Panama Canal transits to 22 a day in January 2024 and the maximum draft to 44 feet. Water levels recovered. In the fiscal year to September 2026 the canal recorded 13,951 transits, up 4.1 per cent, 521 million tons, up 6.5 per cent, and revenue of 6.6 billion dollars, up 15.7 per cent and an all-time record. The full 50-foot draft was maintained throughout the dry season.
A canal short of rain can be fixed by rain, and by a reservoir. A strait full of mines cannot.
These are spot rates and they are falling, which is the part of the story that supports the sceptics. They are also two to four times the levels of late 2023, when the Red Sea was open and Hormuz was not a war zone.
The transmission from a freight rate to a shop is slow, measurable, and very unevenly distributed.
The most careful published estimate is an IMF working paper from March 2022 covering forty-six economies on monthly data from 1992 to 2021, with robustness checks extending to 143 countries. A one standard deviation rise in global shipping costs, which the authors put at 21.8 percentage points, raises import price inflation by 0.3 to 0.4 percentage points after twelve months, with over 90 per cent of that arriving within four. Headline consumer inflation rises by about 0.15 percentage points, building gradually and peaking at twelve months.
Then comes the finding that matters for anyone reading this from an island. The paper reports that the largest response is in island countries, where the maximum effect on headline inflation is more than twice the baseline. Countries whose imports exceed roughly a quarter of domestic consumption show a significantly larger effect on core inflation at thirteen to sixteen months.
A shipping shock is not a global event with a global number. It is a small number in Germany and a large one in Port Louis.
In April 2026 the United Nations Development Programme's economic lab for Mauritius and Seychelles published an assessment of what the Middle East war means for this economy. It is the most specific document of its kind we have seen produced for a small island state during this crisis, and its first table is the whole argument.
The same report models three scenarios. They are modelled estimates rather than observations, and should be read as such, but they are the only quantified public answer to the question this article asks.
There is a serious argument that freight shocks matter far less than articles like this one imply, and it deserves to be put properly rather than knocked down.
Using world input-output tables, the European Central Bank and the OECD have both shown that international maritime shipping accounts for less than one per cent of the final cost of manufactured output in large economies. A forty-foot container holds thousands of garments. Three thousand dollars more on the box is cents on the shirt, and cents on the shirt disappear inside rent, wages, distribution and retail margin, which together account for most of what a shopper pays.
A Federal Reserve Bank of Kansas City study found that a 15 per cent rise in international shipping costs raised American core inflation by just 0.10 percentage points after eleven months. Between 60 and 70 per cent of deep-sea container cargo on the main east to west lanes moves on annual contracts rather than spot rates, so a spike lasting one to three months never reaches most shippers at all. The OECD's conclusion was that monetary authorities should look through these shocks.
All of that is correct, and all of it is about high-value manufactured goods in large continental economies. It stops being correct in two places. The first is low-value, heavy cargo, where freight and insurance are a large fraction of landed cost: grain, fertiliser, cement, fuel. The second is an economy that imports more than half of what it consumes, has no domestic substitute to switch to, and whose consumers spend a large share of income on food and energy.
That is the distinction this edition keeps arriving at. The average is reassuring. The distribution is not.
The barrels are moving again, and that is a genuine achievement of pipelines, shuttle tankers and rerouting rather than of peace. Sixty per cent of Gulf crude still crosses a strait where thirty-seven ships were attacked in October and where the International Maritime Organization has logged 130 incidents and twenty-five deaths since February. The Suez Canal is earning more because the tankers were pushed into it, while four-fifths of its container traffic has still not returned. Panama has recovered completely, because its problem was rainfall.
The cost of all of this is not visible in the volume data. It is in the insurance premium, the extra fifteen days, the second ship, the longer financing period for the cargo, and it lands on whoever is at the end of the chain with no alternative supplier. For an economy importing all of its crude, almost all of its refined fuel and half of its protein, that is not a line in a logistics report. It is the price of dinner.
First, whether container lines return to the Red Sea in volume. Tankers came back under duress. Container operators returning would be a genuine judgement that the corridor is safe, and it would release the roughly one tenth of the world fleet currently absorbed by the longer route around Africa.
Second, what happens to freight rates when that capacity is released at the same time as new ships arrive. The orderbook is very large relative to the fleet, and a simultaneous return to Suez and a delivery wave would push rates down hard. That would be good for importers and brutal for carriers.
Third, the United Arab Emirates' second bypass pipeline to Fujairah, due in 2027. Every barrel that can leave the Gulf without crossing Hormuz reduces what Iran controls, permanently.
Fourth, whether attacks continue through the northern winter. October was the worst month of the war for ships hit. If November and December match it, the gap between a recovered volume number and an unrecovered waterway will widen further, and the insurance market will keep pricing the second while commodity markets price the first.
A chokepoint does not have to close to do damage. It only has to become expensive, and stay that way long enough for the expense to settle into contracts.
Data notes: Attacks and incidents in the Gulf, including the figure of 130 incidents counted by the International Maritime Organization since late February, at least 25 seafarers killed, the Washington Institute count of 37 ships attacked in October, and the events of 7, 8 and 10 November 2026, are from Reuters reporting published on 10 and 11 November 2026. The closure of the Strait of Hormuz on 28 February 2026 and the subsequent military and diplomatic timeline are documented contemporaneously; this article reports the shipping and energy consequences rather than the conduct of the war. Crude export volumes and route shares are from Kpler's published explainer on Middle East Gulf exports, covering the pre-war average of March 2025 to February 2026, the March 2026 trough and the period 1 to 28 September 2026, with a data cut-off of 29 September 2026; Kpler counts only confirmed vessel movements, so its figures are minimums that may be revised upward. Suez Canal revenue and transit figures are from Egypt's CAPMAS and the Suez Canal Authority as reported by Bloomberg in September 2026, with quarterly figures and the statement that container traffic is down about four-fifths from reporting of 29 August 2026. The count of 53 container vessels transiting Suez and one transiting Hormuz in the week to 12 November 2026 is Drewry's, and covers container vessels only; Hormuz is overwhelmingly a tanker route, so that figure is not a measure of total traffic through it. Container freight rates are Drewry's World Container Index for the week ending 12 November 2026. Panama Canal fiscal year 2026 figures are preliminary and unaudited, announced by the Panama Canal Authority on 21 October 2026. Inflation pass-through estimates are from Carriere-Swallow, Deb, Furceri, Jimenez and Ostry, IMF Working Paper 22/61, March 2022, including the finding that the maximum effect on headline inflation in island countries is more than twice the baseline. Mauritian import dependence, trade openness and the three scenarios are from the UNDP Economic Lab for Mauritius and Seychelles, April 2026, authored by Dr Jamiil Jeetoo, drawing on Statistics Mauritius supply and use tables; the scenario results are modelled estimates, not observations, and are presented as such. The counter-arguments are from the European Central Bank and OECD input-output analyses and from Herriford, Johnson, Sly and Smith for the Federal Reserve Bank of Kansas City. Qatari liquefied natural gas force majeure, the damage to Ras Laffan in March 2026, the cancellation of cargoes to Pakistan, Bangladesh and an Italian buyer, the share of global supply passing through the strait and the level of European and Asian gas prices are from The National, 28 September 2026. Research supplied to this desk included figures for war risk insurance premiums, bunker prices and tanker rates drawn from secondary aggregators which we could not confirm against the underlying assessments, and those figures are not reported here.
Content Protected
This article is the original work of The Meridian and is protected by copyright. Please link to it rather than reproducing it.