The World Borrowed $348 Trillion
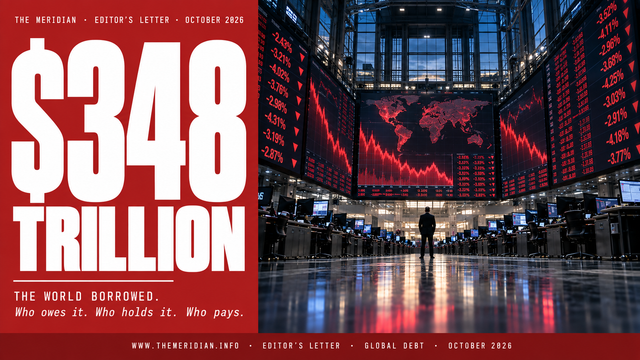
$348 trillion is the biggest number in human history. When the bill arrives, it will not be paid by the people who borrowed. This edition is about who defers it, who absorbs it, and who never had the option of either.
$348 trillion is the biggest number in human history. It is larger than the combined economic output of every country on earth for three consecutive years. It is the total sum of every mortgage, every government bond, every corporate loan, every credit card balance, every infrastructure project financed on borrowed money, accumulated across every economy on the planet. It is, in the most precise sense available, the price of the modern world. (Source: IIF Global Debt Monitor, 2025)
The question this edition asks is not whether that number is too large. That debate is settled. The question is simpler and more consequential: when the bill arrives, who pays it?
The answer, as this edition will demonstrate across twenty-seven articles, is not the people who did the borrowing.
In August 1971, Richard Nixon closed the gold window. The United States unilaterally suspended the convertibility of the dollar to gold, ending the Bretton Woods system that had governed global finance since 1944. The immediate cause was a run on US gold reserves. The lasting consequence was something nobody announced and nobody voted for: the removal of the only external constraint on how much governments could borrow. From that moment, the limit on sovereign debt became political rather than monetary. Governments could borrow as long as creditors were willing to lend. Creditors were almost always willing to lend, because the alternative generated no return at all.
In the 55 years since that August afternoon, global debt has grown from approximately $20 trillion to $348 trillion. The trajectory was not accidental. It was the entirely predictable consequence of removing a constraint without replacing it with anything else.
Not all of this debt is government debt. Of the $348 trillion total, governments account for $111.5 trillion. (Source: IMF World Economic Outlook, April 2026) The remainder sits on the balance sheets of households, corporations, and financial institutions. But government debt is where the political choices live. It is where austerity programmes are designed, where bond markets apply pressure, and where the cost of servicing the debt competes directly with the cost of running hospitals, schools, and pension systems.
The numbers at the country level are worth sitting with. The United States carries $36 trillion in federal debt, a figure that in fiscal year 2026 generated interest payments exceeding the entire defence budget for the first time in American history. (Source: Congressional Budget Office, 2026) Japan has borrowed 263% of its own annual economic output, a ratio sustained for three decades by a combination of near-total domestic ownership, central bank intervention, and zero interest rates: three conditions that are all now changing simultaneously. (Source: IMF, Japanese Ministry of Finance, 2026) The United Kingdom holds net debt of £2,990 billion, equivalent to 94.9% of GDP, with annual interest payments reaching £109 billion in 2025-26 alone. (Source: ONS, June 2026; OBR, 2026) France sits at 112% of GDP with growth of 0.8% in 2026, a combination that makes the arithmetic of consolidation close to impossible without political rupture. Italy carries 140% of GDP and has not grown in any meaningful sense in three decades. (Source: European Commission, May 2026)
These are the economies that set the rules of the global financial system. They have not been required to cut food subsidies, privatise water utilities, or reduce civil service wages as a condition of accessing financial support. The countries that face those requirements are different countries.
Kenya issues government bonds at a yield of approximately 16%. The United States issues ten-year Treasury bonds at 4.5%. These are the same instrument, the same maturity, the same basic promise: a government will repay borrowed money with interest over a fixed period. The cost difference, four times as much for Kenya as for the United States, is not explained entirely by default risk. It is explained in large part by which country issues the reserve currency, which country sets the global risk-free rate, and which country does not. (Source: Bloomberg, World Bank, 2026)
Kenya government bond yield: 16%. US Treasury yield (10-year): 4.5%. Same instrument. Same maturity. Four times the cost. The spread is not fully explained by default risk. It is explained by who issues the reserve currency and who does not.
In 1825, Haiti was required to pay France 150 million gold francs as the price of diplomatic recognition: borrowing to compensate the former enslaver for the cost of Haitian freedom. The final payment was made in 1947. One hundred and twenty-two years. The doctrine of odious debt, which holds that obligations incurred without the consent of a population and against its interests are not legally binding, has existed in international law since 1927. No court has ever applied it to a sovereign government.
This asymmetry is not a footnote. It is the central political economy of global debt, and it is the lens through which The Meridian reads every number in this edition.
"The people who benefit most from borrowed money are not always the people who repay it."
This edition does not argue that debt is bad. It argues something more specific. Debt, like most instruments of economic life, distributes its benefits and its costs unequally. The governments whose populations bear the harshest conditions of repayment are not always the governments that designed the system under which those conditions were imposed. The countries that borrowed at the highest cost had the least say in determining what that cost would be.
Twenty-seven articles examine these questions from every angle the evidence supports. Section I traces how $348 trillion was built, from the gold window to the present. Section II names the creditors: who holds the debt, what they want, and what leverage they exercise. Section III is The Meridian's signature contribution to this debate: the structural asymmetry between what debt costs in the Global North and what it costs everywhere else. Section IV is seven country portraits, from the United States to Kenya, of what it actually looks like to carry sovereign debt at different points on that asymmetry. Section V names the options: austerity, inflation, default, and the debt jubilee that serious economists are beginning to discuss in public.
The cover story stands apart. The war in Ukraine, now entering its fifth year, has added trillions to global debt through energy costs, food prices, defence spending, and humanitarian financing. The man most directly responsible for that addition has just been re-elected with 87.28% of the vote. He has a GDP growth rate of 3.6%, unemployment below 3%, and an economy that has absorbed sanctions the West designed to collapse it. He has $300 billion in frozen assets he would like returned. He would like you to know he is very comfortable. (Source: Central Election Commission of the Russian Federation, March 2024; IMF, Rosstat, 2026)
What does he actually want? The answer turns out to be more coherent, more patient, and more concerning than most Western commentary allows.
$348 trillion sits in spreadsheets maintained by the Institute of International Finance, the IMF, the World Bank, and the finance ministries of 190 countries. It will be revised upward in next year's edition of this data, as it has been revised upward in every edition for 50 years.
But behind each trillion is a specific decision: a government that chose to borrow rather than tax, a population that was not consulted, a creditor that imposed conditions, a generation that will repay a debt it did not contract. The number is the aggregate of those decisions. The reckoning is what happens when the aggregate can no longer be deferred.
This edition is about who defers it, who absorbs it, and who never had the option of either.
Add comment
Comments